


 TRAINING


 PAPERS
 REFERENCES
 GET IN TOUCH

|

|
 Downloads
|
 Prices
|
 Videos
|


GeolOil - Ionic Water Salinity and Formation Water Resistivity Rw
The water salinity of a solution is the equivalent concentration of pure Sodium Chloride (NaCl, or common salt) poured in distilled water that would yield the same electrical resistivity response (and conductivity) as the original sample.
Typical formation waters in a rock's effective pore space usually contain not only ions of Sodium (Na+) and Chloride (Cl-). Positive ions (cations), like the metals: Calcium (Ca++), Magnesium (Mg++), Potassium (K+), Iron (Fe++), Lithium (Li+), Strontium (Sr++), and Barium (Ba++), are also commonly found, occasionally with traces of Ammonium (NH4+). Since normally a water solution is electrically neutral, the cations are balanced with milliequivalent charges of negative ions (anions), like Bicarbonate (HCO3- -), Sulfate (SO4- -), Nitrate (NO3-), Carbonate (CO3- -), Bromide (Br-), Iodine (I-), Hydroxide (OH-), and Fluoride (F -).
Formation water salinity in the effective pore space is the major driver of electrical conductivity of a rock (together with clays that may be present in clastic matrices; and occasionally pyrite FeS2). Hence, the sample's equivalent water salinity in parts per million (PPM) of NaCl, is related to the water resistivity Rw that appears in the classical water saturation equations of Archie, Simandoux, Indonesia, and Fertl.
Once a representative and reliable non-contaminated water sample from a reservoir is taken, it is usually sent to a lab to conduct a water analysis to find the ionic composition of the formation water. GeolOil petrophysics software ships with a module to compute the equivalent water NaCl salinity from the ionic concentrations in PPM or mg/liter:
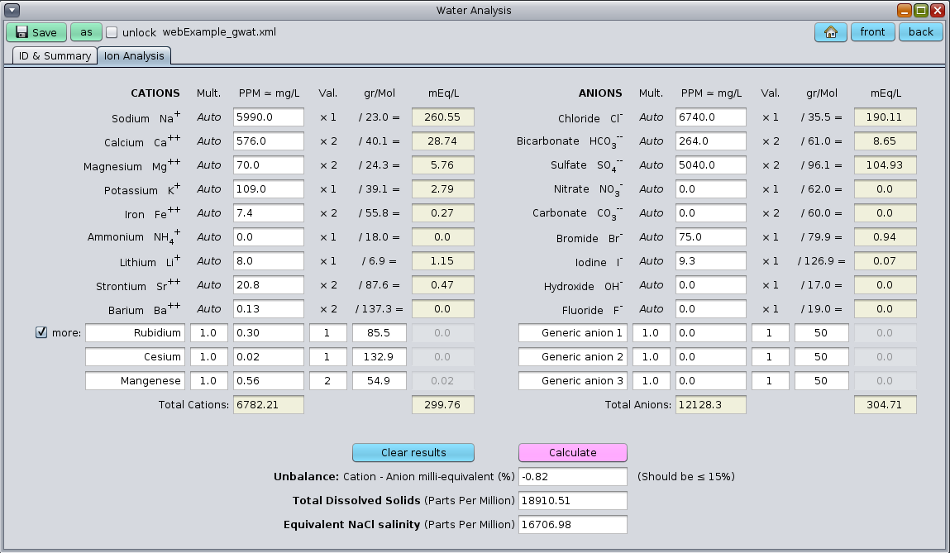
The GeolOil software module for water analyses
Some remarks deserve be mentioned from the picture above:
-
The amount of Total Dissolved Solids (TDS), which is the total summation of cations and anions, is not
the equivalent NaCl water salinity. This is because of two reasons. Firstly, different ions have different electrical
valences (usually +1, +2, -1, and -2), so their contribution to the electrical balance neutrality is different per ion.
Secondly, each ion has a different electro-chemical behaviour, so even taking into account the valences, the ions
have different weights when they are combined to compute an equivalent NaCl water salinity. Below are the equations
to calculate TDS and the equivalent NaCl water salinity:

Notice that the weights themselves depend upon TDS. Since Na and Cl are the ions of pure Sodium Chloride NaCl, their weights as expected are always 1.0 to contribute to the NaCl water salinity. However, other ions have different weights around 1.0. The following table shows some weights for Wi(TDS):
TDS (ppm) Ca++ Mg++ HCO3- - SO4- - 10 1.30 2.20 0.35 0.78 100 1.29 1.89 0.35 0.77 1,000 1.10 1.62 0.34 0.69 10,000 0.79 1.28 0.29 0.50 100,000 0.71 0.52 0.18 0.30 -
Since the formation water is electrically neutral (you don't expect to touch the water and suffer an electric shock),
the electrical charge unbalance between cations and anions milli-equivalents, should not differ more than 10% or 15%.
Otherwise, the ionic water analysis lab result is not reliable. On those unbalanced cases, the samples probably were measured
with legacy, poor old quality equipment and they lack to detect some cations or anions.
Although it is not possible to guess and recover the lost ionic measurements, a reasonable workaround to come with some approximate value of the water salinity is to synthetically complete the milli-equivalent balance. That is, add numerically a necessary cation or anion with a valence of 1, until the electrical milli-equivalent balance is close to 0%. It not is guaranteed, but the synthetically completed water salinity may be closer the missed water salinity that failed to be estimated.
→ When water analyses are got, is essential to assess the quality in terms of:
1. Chemical reliability.
2. Space representativity.
3. Time representativity.
- Chemical reliability: Make sure that water sample has not been contaminated (for example, contaminated with waters from nearby injection processes), and really comes from the target reservoir to study. Is the milli-equivalent balance acceptably close to 10%-15%. If not, would it be reasonable to complete it synthetically?. Is the salinity value too fresh, or too salty for the expected deposition environment?
- Space representativity: Make sure that water sample can be associated correctly with the formation depth under study. Did it come from a well known depth that belongs to the formation?. How the sample was collected? Are there several isolated compartments in the formation? Are the different salinity values reasonable evidence of compartmentalization, or the values can not be trusted?
- Time representativity: Was the water sample taken at a representative time frame of the reservoir life? For instance, if a reservoir study aims to model the initial reservoir water saturation, the sample should has been collected in the very early stage of reservoir discovery before any major exploitation. Then the legacy log analyses would represent the initial water saturation reservoir condition. Likewise, if the water sample is collected later in the reservoir life, close to the deep resistivity log date, the water salinity may give a clue of the water saturation at such time frame, which may give an idea of how much remnant reserves are still in the reservoir.
⚠ WARNING: All log resistivity curves —no matter how good work did the logging service
company— can face both space representativity and time representativity issues: Is the interpreted zone in an isolated
compartment? How early was the well SPUD date and logging date? If such date happened several years after discovery, the resistivity
curve would represent the measure related to depletion, water advance, and perhaps contamination due to injection process (if any).
In those cases, any SW model would not be suitable for initial volumetrics or to initialize a simulation process.
Consider then a SW model based on capillary pressure height.
∎
The more ions has a water solution, the more conductivity (easier to conduct electricity) and hence less resistivity Rw. The following tables summarize the relationships between common rock parameters:
|
How SW, SO and SG change as a parameter increases
|
How SW, SO and SG change as a parameter decreases
Water salinity computation from ionic water analyses is perhaps the best technique to estimate the equivalent NaCl salinity and its companion Rw at the reservoir temperature. However, there are other techniques that worth a try. The table below summarizes the most popular techniques to estimate either salinity or Rw, orderer from the most reliable to the less:
NaCl or Rw Method |
Qual. |
From |
Remarks |
|
| 1 | Ionic Water Analysis | Best | Water sample | Water sample must be representative. Independent, log free technique |
| 2 | Rw from water bodies and pockets | Good | Logs | Needs to find 100% water bodies to work, like aquifers or water pockets |
| 3 | Hingle Plot | Good | Logs | Same math as Rw from H2O body, but from a cross-plot. |
| 4 | Core SW vs. log SW match | Med. | Logs and Core | Move salinity until match. Needs accurate lab SW measurements. |
| 5 | Pickett Plot | Poor | Logs | Rw & m estimation. Does not work if Phi is almost constant in water body |
| 6 | SP Spont. Potential | Worst | Logs | Last resource to try. Seldom yields accurate or usable Rw estimates |
Techniques to estimate equivalent NaCl water salinity and Rw
It is easy to grab an idea on how salty is a water solution. For instance, drinkable water has a salinity of up to 100 NaCl mEq PPM. Agriculture irrigation water up to 2,000 NaCl mEq PPM. Sea water, around 35K-50K NaCl mEq PPM (except the dead sea, with a salinity of around 300K NaCl mEq PPM). Shallow reservoirs influenced by fresh meteoric waters (from rivers and precipitation) around 1K-3K NaCl mEq PPM. Some braided channel reservoirs 3,000 ft of depth, around 10K-30K NaCl mEq PPM. Some carbonate reservoirs in the US (like those in Wyoming and Montana) with complex mineralogy can reach high salinities up to 100K-200K NaCl mEq PPM.
Usually, the deeper the reservoir, the larger geological time it has had to dissolve minerals into ions, and the saltier the reservoir. It is quite common to find reservoirs with relevant differences of salinity for different formations. Hence, it is an advisable practice not to describe a reservoir by a pair of values Rw and Temperature, because Rw varies with temperature within a solution of constant salinity (and temperature also varies with depth). It is preferred to describe the reservoir by a distribution of salinity per formation (like a layer cake), and occasionally salinity has to de described by a full 3D behaviour. That is, salinity = f(x,y,z).
Given a known reservoir temperature, salinity to resistivity Rw conversions has a one to to one correspondence that can be easily handled with GeolOil Software:
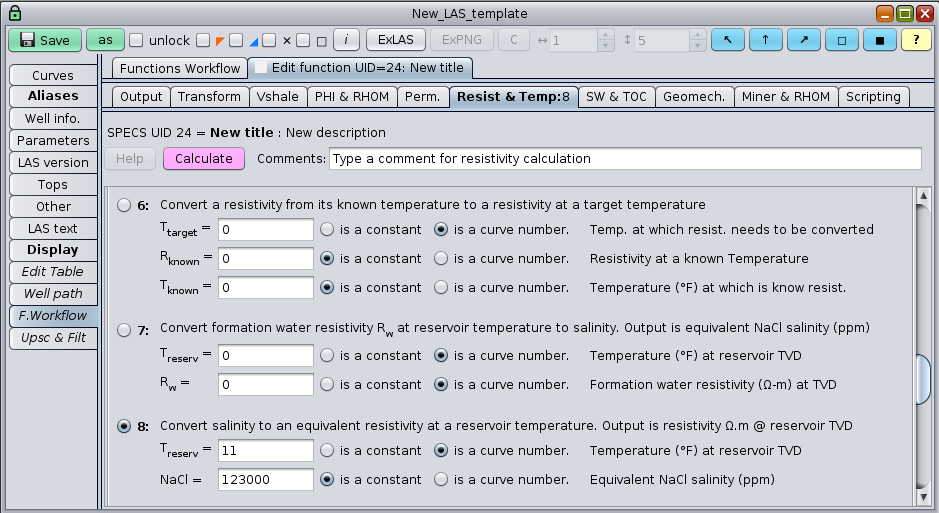
Conversion functions between salinity and Rw
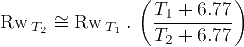
The equation to convert water salinity to formation water resistivity Rw, and the equation to convert Rw between two different temperatures T1 and T2 (in Fahrenheit degrees) are respectively:

Also, approximate conversions from well True Vertical Depth (TVD), to temperature are easily estimated:
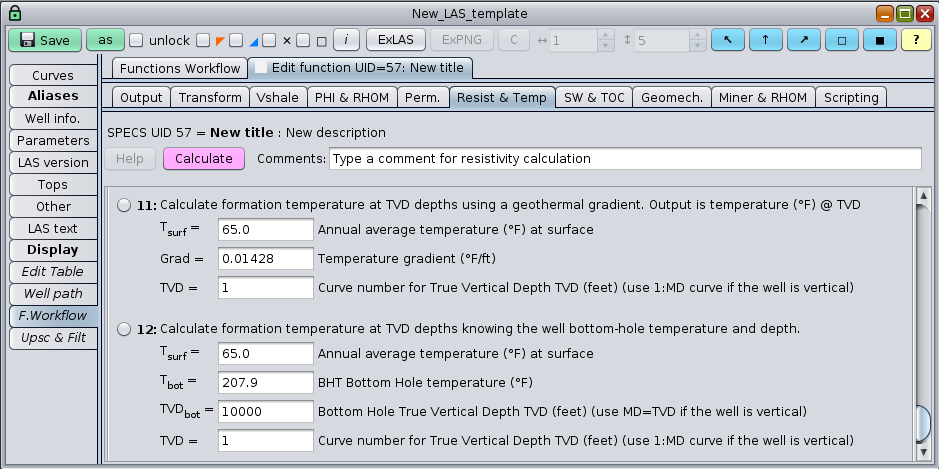
Conversion functions between TVD and temperature
We recommend the following methodology to build a 3D model for the formation water resistivity Rw = Rw(x,y,z):
- Collect all legacy water analyses available for the wells in the reservoir. Assess their chemical reliability, space representativity, and time representativity. If necessary and reasonably, synthetically complete those old water analyses with milli-equivalent unbalances larger that 10%-15%, by adding necessary ions of valence 1 to achieve a close to 0% ionic unbalance.
- Build 2D maps for the water salinity areal (x,y) distribution. One map per formation. If there are no major differences on salinity for a formation, prefer a constant salinity average for each formation. If there are major areal salinity differences, consider the possibility of compartmentalizations. In either case, produce the collection of 2D maps for the formations.
- Now for each logged well, arrange for its (x,y) coordinates (not its surface coordinates location -unless the well is vertical-), its salinity 1D profile f(z) (a vertical succession of salinities). Calculate a log curve for the temperature profile of the well and compute then a log curve for Rw. This model is finally an approximate reasonable 3D model for the formation water resistivity Rw = Rw(x,y,z).

|
Related articles:
|

|
Related video:
|
|
| |


|
|
|
© 2012-2026 GeolOil LLC. Please link or refer us under Creative Commons License CC-by-ND |