


 TRAINING


 PAPERS
 REFERENCES
 GET IN TOUCH

|

|
 Downloads
|
 Prices
|
 Videos
|


GeolOil - How to define a Pay Indicator Index from well logs
The apparent water resistivity Rwapparent can be used qualitatively to screen and detect pay and transition zones. Since it uses porosity information in its equation, it provides more accuracy and discriminatory power than the single naked eye inspection of a deep resistivity curve. Assuming that we are dealing with clean non-shaly, non-conductive matrix rocks, the Archie water saturation equation can be rewritten for the formation water resistivity Rw as:

This is because Rwapparent = φm . Rt / a, which only yields the correct value of Rw in water zones where SW=1. The equation can be re-arranged to define a Pay Indicator Index (P.I.) as:

The Pay Index defined above should be used as a qualitative indicator value of the presence of oil, natural gas, and CO2. Its value is close to 1 for clean water zones and aquifers, and larger than 1 in transition and pay zones. Since the Pay Index is meant to be used qualitatively as a screening detection tool for pay zones, it works well even when the estimates for φ, m, and a, are not known with big precision. Pay index really pops out large numbers in the presence of oil, as shown in the following table (assuming n=2):
| SW = | 1.0 | 0.8 | 0.7 | 0.6 | 0.5 | 0.4 | 0.3 | 0.2 | SWirr≅0.1 |
| SO, SG = | 0.0 | 0.2 | 0.3 | 0.4 | 0.5 | 0.6 | 0.7 | 0.8 | 0.9 |
| Pay Index = | 1.0 | 1.6 | 2.0 | 2.8 | 4.0 | 6.2 | 11 | 25 | 100 |
From a practical point of view, these coarse steps could guide to screen the presence of oil, natural gas, and CO2:
- Compute the apparent water resistivity using Rwapparent = φm . Rt / a, even with preliminary coarse approximate values for φ, m, and a.
- Take an estimate for Rw, the real formation water saturation. If feasible, calculate Rw from an available chemical ions water analysis. If not possible, estimate Rw from logs with methods like Hingle, or Pickett Plot.
- Calculate the Pay Index as P.I. = Rwapparent / Rw .
- If the Pay Index is systematically less than 0.5, perhaps the value chosen for Rw was not appropriate, or the reservoir column has variable salinity.
- If the Pay Index is between 0.5 and 1.5, the zone could be a water pocket or an aquifer.
- If the Pay Index is between 1.5 and 7.0, the zone could be a transition zone, embedded with partial oil and water (However the reference value of 7.0 depends upon the actual irreducible water saturation).
- If the Pay Index is larger than 7.0, the zone could be a pay zone. That is, the rock is completely impregnated with oil, gas, or CO2, except for the unavoidable amount of the rock's irreducible water saturation SWirr (Again, the reference of 7.0 depends upon SWirr).
- If the Pay Index is systematically larger than 100.0, double-check the computations and parameters. Something could be wrong.
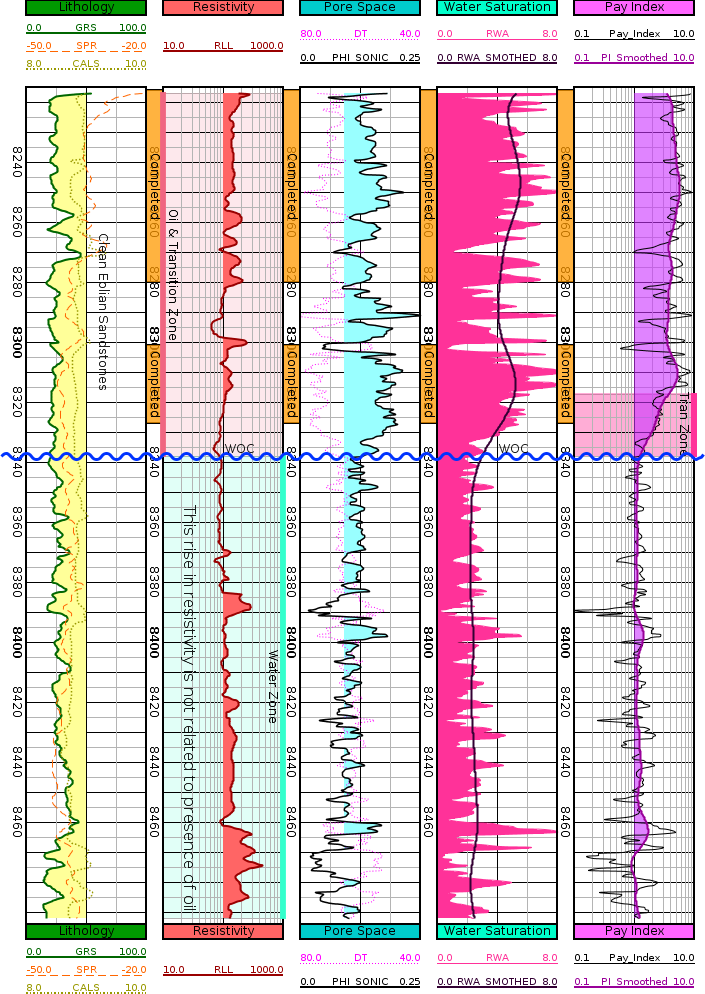
A log display of a Pay Index in the last track. Notice the curve filling after PI>1
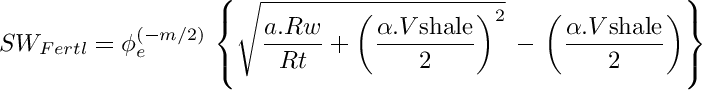
The theory introduced above is only applicable for clean, non shaly rocks with non conductive matrix. Otherwise, corrections must be made to take into account the excess of conductivity carried out by clay minerals. The Fertl (1975) water saturation approximation model for shaly sands is among the easiest to treat mathematically (α is a reservoir dependent, empirically adjusted 0.25 ≤ α ≤ 0.35 parameter):
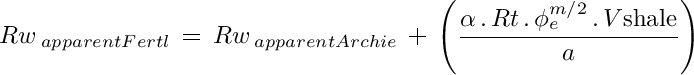
After some algebraic manipulations, a shale-corrected apparent water resistivity to be used in the Pay Index is reduced to:
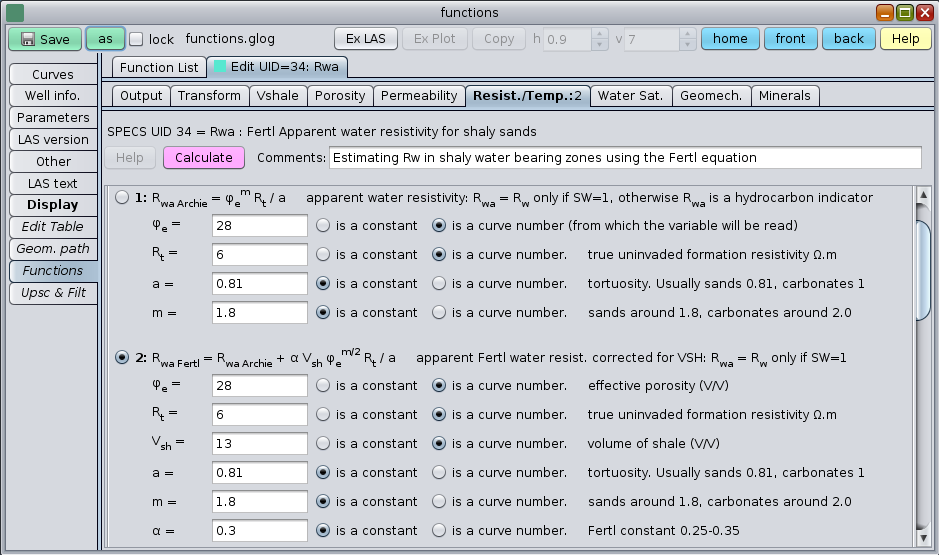
The GeolOil panel to estimate the Rwa apparent water resistivity curve in a shaly sand

|
Related articles:
|
|
| |


|
|
|
© 2012-2026 GeolOil LLC. Please link or refer us under Creative Commons License CC-by-ND |