


 TRAINING


 PAPERS
 REFERENCES
 GET IN TOUCH

|

|
 Downloads
|
 Prices
|
 Videos
|


GeolOil - How to interpolate petrophysical properties
The interpolation of physical properties is a routinely task. Most computations can not be performed with missed values, so the void gaps between data points need to be filled with some valid estimates. Widely used 1D knots {(x,y)} piecewise interpolation techniques are Linear Interpolation, Splines Cubic Interpolation, and Akima Interpolation. This article, first published on Nov 27th 2022, introduces the GeolOil interpolation technique.
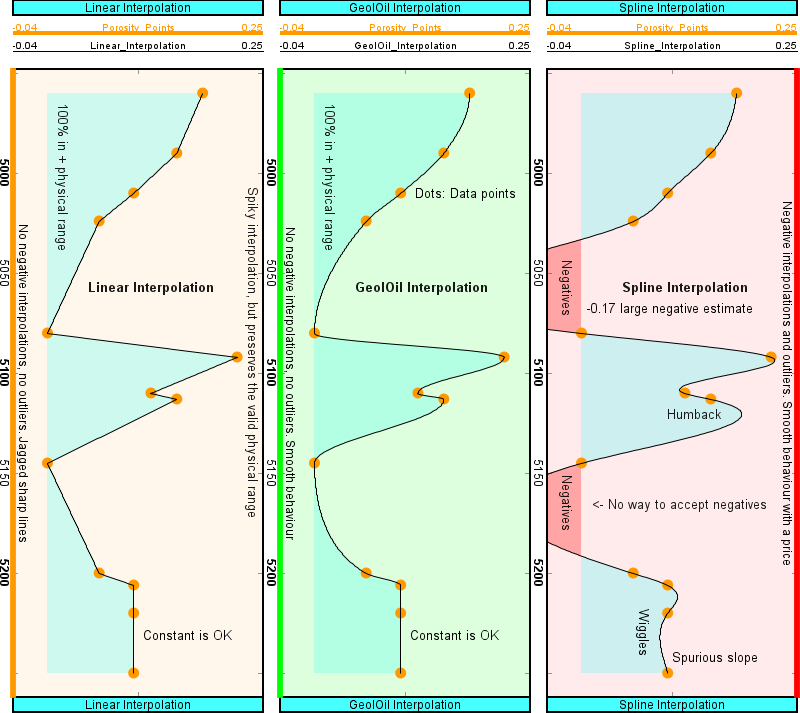
Linear, GeolOilTM, and Spline interpolations compared
No technique is perfect, each one has advantages and disadvantages. In the context of interpolation of physical properties "we want" to define a technique that fulfills as much as possible these six criteria:
- The interpolation must be exact. That is, it has to pass exactly through each knot {xi, yi} i=1,2,...,n. Regression techniques, like linear or kernel, do not satisfy this. Linear interpolation, cubic, Akima splines, and Kriging do satisfy this.
- The interpolation must be non-parametric. That is, the algorithm should not need adjustments of parameters and functions. The algorithm should yield an unique deterministic response, independent of any person analyses. For instance, the geostatistical technique Kriging does not satisfy this, as it requires the adjustment of variogram functional forms, shapes and parameters, and different persons could come with different results.
- The technique should produce values in the sampled range. Of course there could be legit y=f(x) values outside of the sampled range seen by the collection of knots {(x1, y1), (x2, y2), (xi, yi), ..., (xn, yn)}, but as the sample and its density becomes larger n → ∞, we have a good chance to catch a "good" behaviour. That is, (min,max) {f(x)} = (min,max) {yi} i=1,2,...,n Noticeable, cubic and Akima splines, easily fall out of the range. That is the price to pay for a smooth interpolation.
- Each adjacent segment interpolation should be monotonic. That is, for all sampled adjacent pairs {(xi, yi), (xi+1, yi+1), the interpolated value y must lie between min{yi, yi+1} and max{yi, yi+1}. Again, neither cubic nor Akima splines satisfy this.
- The interpolation must yield a continuous function. All the techniques we have mentioned satisfy this.
- The interpolated function should be smooth, as much as possible after the former conditions are fulfilled. Spline interpolation has both continuous first derivate and second derivative, producing nice appealing results, but lacks of some of the criteria mentioned above. The linear interpolation method satisfies all of these criteria except this one. This is why it is usually the default interpolation technique for most software.
 As seen in the former well log plot for the estimation of effective porosity, the GeolOil interpolation technique
produces a smooth, nice appealing result that usually satisfies the above criteria. However, it not always succeeds to satisfy
a perfect smooth shape with continuous 1st and 2nd derivatives. Overall, we can say that this interpolation technique
is among the best ones available. The GeolOil interpolation can be extended to always satisfy continuous derivatives,
at a price of a longer, slow iteration process. The current fast API algorithm is implanted in Java, and available for
licensing as a math library for software companies.
As seen in the former well log plot for the estimation of effective porosity, the GeolOil interpolation technique
produces a smooth, nice appealing result that usually satisfies the above criteria. However, it not always succeeds to satisfy
a perfect smooth shape with continuous 1st and 2nd derivatives. Overall, we can say that this interpolation technique
is among the best ones available. The GeolOil interpolation can be extended to always satisfy continuous derivatives,
at a price of a longer, slow iteration process. The current fast API algorithm is implanted in Java, and available for
licensing as a math library for software companies.
| Knot | x = depth (ft) | y = φ (v/v) |
| 1 | 4960 | 0.18 |
| 2 | 4990 | 0.15 |
| 3 | 5010 | 0.10 |
| 4 | 5024 | 0.06 |
| 5 | 5080 | 0.00 |
| 6 | 5092 | 0.22 |
| 7 | 5110 | 0.12 |
| 8 | 5113 | 0.15 |
| 9 | 5145 | 0.00 |
| 10 | 5200 | 0.06 |
| 11 | 5206 | 0.10 |
| 12 | 5220 | 0.10 |
| 13 | 5250 | 0.10 |
The knot data points for the log-plot interpolation
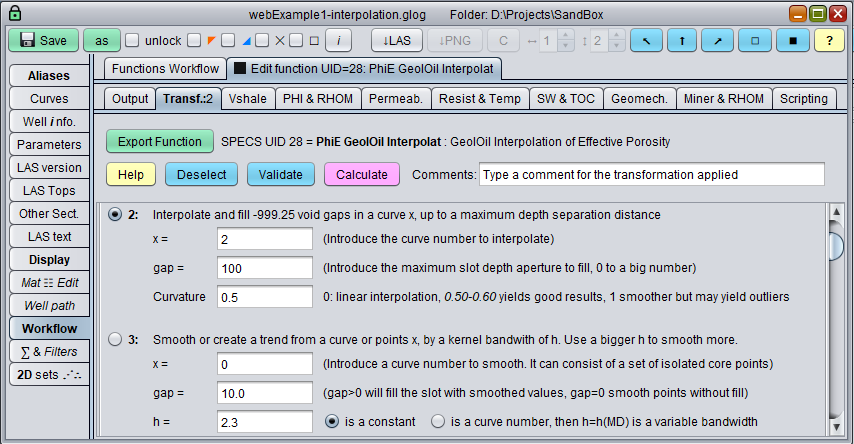
The GeolOil GUI interpolation window. Or use the GLS script curve.interpolation() function

|
Related article:
|
|
| |


|
|
|
© 2012-2026 GeolOil LLC. Please link or refer us under Creative Commons License CC-by-ND |