


 TRAINING


 PAPERS
 REFERENCES
 GET IN TOUCH

|

|
 Downloads
|
 Prices
|
 Videos
|


GeolOil - How to calculate Rw and m porosity cementation exponent from well logs
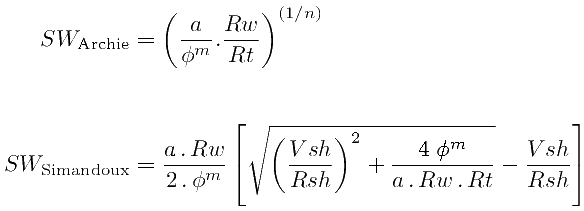
The "m" cementation exponent is the adimensional power parameter for porosity in the Archie water saturation equation, the Simandoux equation, the Indonesia equation, and others. The higher the m, the higher SW water saturation.
This parameter m depends upon the pore space structure connectivity, the matrix consolidation, and the grains shape (more than the size). Historically, m has been called cementation exponent, but the term porosity exponent is also used.
When the tortuosity factor "a" is fixed to 1.0, a default value of m=2 is usually used (also with n=2), but this is more representative for carbonates. For clastic sandstones, the m value ranges from around 1.3 for completely unconsolidated sands, to 2.2 for very well consolidated or cemented sandstones. Typical values for water wet consolidated sandstones range 1.5-1.9. The lower the m value, less free movable water saturation is calculated for the rock.
The Archie equation involves four variables: SW, φ, Rw (formation water resistivity), and Rt (true -deep non invaded- formation resistivity), and three parameters: a, m, and n (the saturation exponent). That means that in the well logging practice, some assumptions must be made or the system would be undetermined. —However, if representative water samples with ionic analyses are available, electro-chemical computations of salinity and Rw are usually more reliable and preferred—
Since the Archie equation works well for non shaly rocks, the easiest way to estimate some unknowns is to work in clean zones (Vsh=0) embedded in SW=100% water, and collect (φ, Rt) log data to solve the unknowns. In some reservoirs, the irreducible water saturation SWirr can be reasonably well known (for example, around 15%) to work with clean rocks in fully oil impregnated zones.
The most used methods to estimate parameters from the Archie equation, are the Hingle, the Pickett Plot, and the apparent cementation exponent methods:
-
Hingle methodassumes that a, m, and n, are known, and solves Rw from the log porosity φ and the formation resistivity Rt in a clean, water bearing zone.
The method produces the best, most stable and precise estimate of Rw from log data. This is the mathematical analog of averaging the apparent water formation resistivity Rwa values in a clean, water bearing zone:
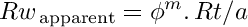
The apparent water saturation curve yields the correct value of Rw in clean, water bearing zones, but yields an overestimated value in hydrocarbon bearing zones. Better than a direct examination of high deep resistivity Rt values, Rwa provides a correction for porosity, so it is a very effective and popular screening technique to detect pay zones. -
Pickett Plot methodassumes that a, and n, are known, and simultaneously solves Rw and m in a clean, water bearing zone from the log porosity φ and the formation resistivity Rt. However, it requires enough heterogeneous porosity rocks. This condition usually fails in many reservoirs with homogeneous rocks in the water bearing zone. Use it judiciously with caution.
To overcome the problem of dealing with clean rocks, we recommend to use a modified Pickett Plot equation specifically designed to work with shaly rocks (Vsh > 0). This easily increases the rock's sample size, avoiding the problem of an almost nil variance on porosity that produces a unstable value of m. Also, the inclusion of clays in the estimation adjusts the m estimate: As the shaliness increases, the m porosity cementation exponent increases, and as the rock becomes cleaner, the exponent decreases.
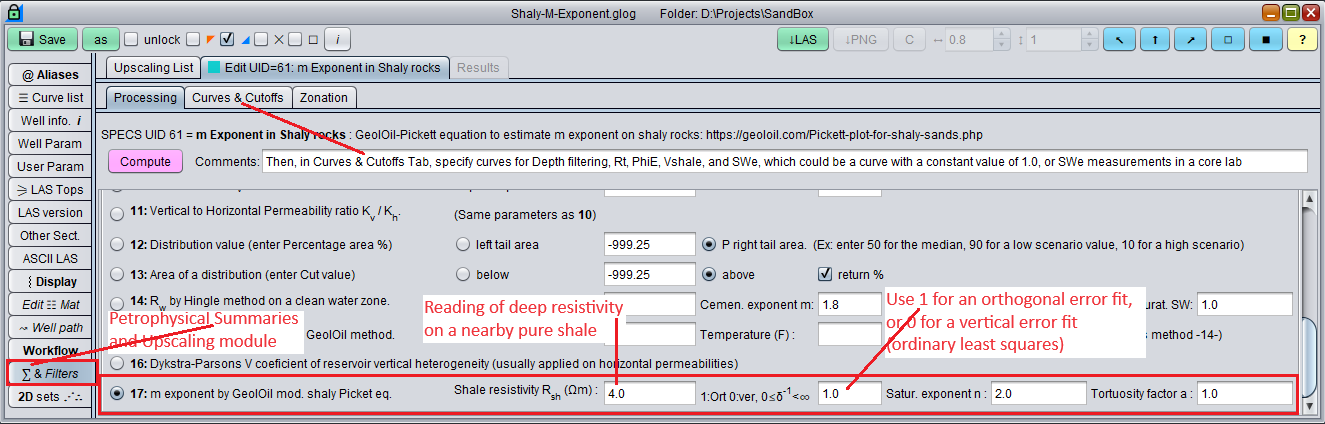
The GeolOil panel to estimate the m porosity cementation exponent on shaly rocks
-
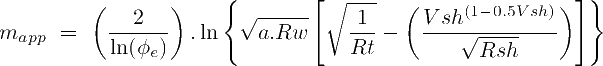
Apparent cementation exponent methodassumes that a, and n, are known. But also that Rw is known from other source different than Hingle or Rwa to avoid any mathematical circularity. Typically, Rw is estimated form ion chemical water analysis lab samples. Then, solving the Archie equation for m, and setting SW=1 for a clean, water bearing zone, yields:
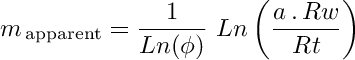
The apparent cementation exponent curve yields the correct value of m in clean, water bearing zones, but yields an incorrect value in hydrocarbon bearing zones.
The equation also proves that Rw < Rt for rocks with non conductive matrix. Otherwise the equation could yield a negative estimate for m. From the hands-on logging practice point of view, an anomalous case where Rt < Rw usually indicates either the presence of conductive minerals, a variable Rw zone not considered in the petrophysical interpretation, unreliable values for Rw, Rt, or a bad deep resistivity tool signal.
If the rock matrix is conductive (has metals or semi-conductor minerals like pyrite FeS2) the Archie equation and some of the formation evaluation theory dealing with water saturation equations is not applicable and corrections must be applied to deal with a conductive matrix (like the excess of conductivity for shaly sands models).
The Indonesia equation can be rewritten to provide an explicit correction for shale content:
Don't hesitate to prefer to use this equation to estimate m in moderately shaly sands (say VSH < 25%) instead of the traditional Pickett plot technique. It usually works well and provides the correct theoretical framework to estimate m for shaly rocks. Notice that if Vsh=0 the equation reduces algebraically to the former Archie m apparent equation.
Is there an easy way to determine the water saturation exponent n from well logs? Not really. The basic problem is that a log independent knowledge of SW would be required, and core lab water saturation data is not often reliable or accurate. A default value of n=1.9 to n=2.1 is usually an useful approximation implicitly used in many well logging equations and theory.
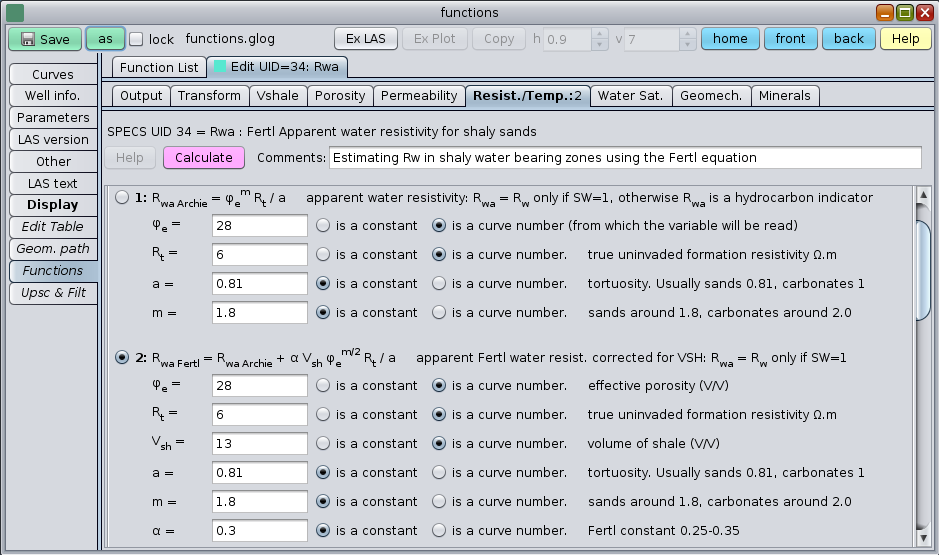
The GeolOil panel to estimate the Rwa apparent water resistivity curve in a shaly sand
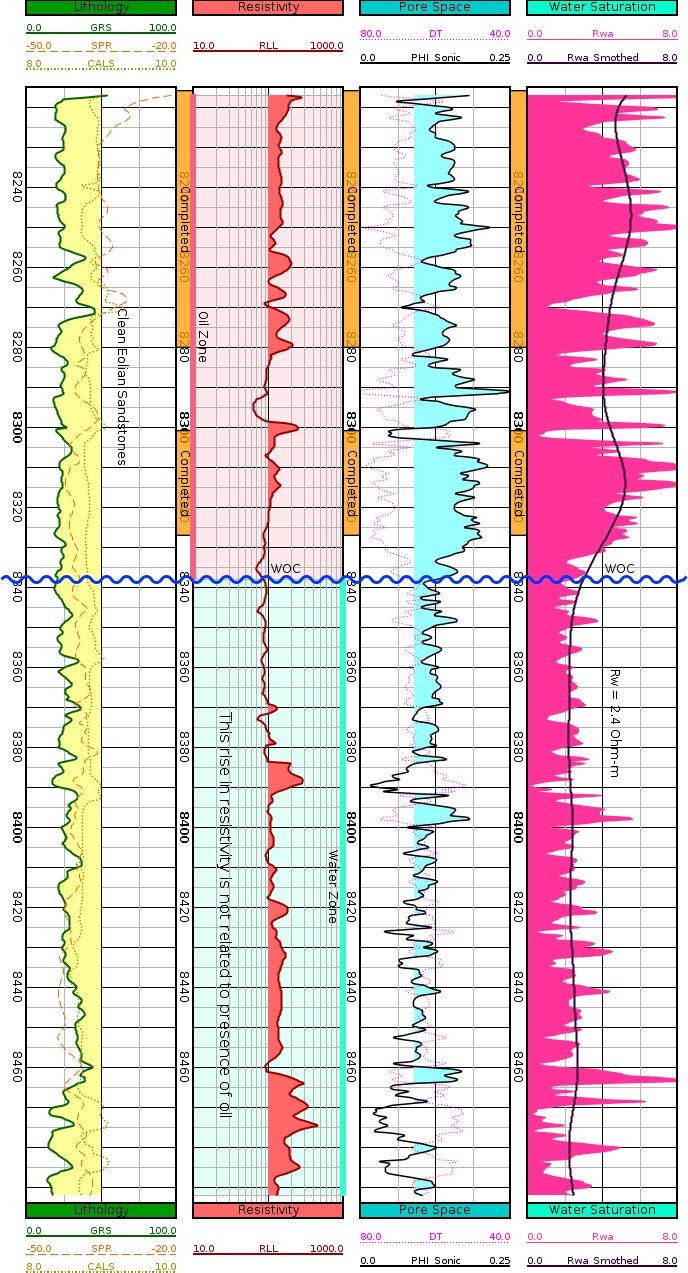
Resistivity fails to detect water oil contact, but apparent water resistivity does, confirmed by production

|
Related articles:
|
|
| |


|
|
|
© 2012-2026 GeolOil LLC. Please link or refer us under Creative Commons License CC-by-ND |