


 TRAINING


 PAPERS
 REFERENCES
 GET IN TOUCH

|

|
 Downloads
|
 Prices
|
 Videos
|


The GeolOil LAS file well log displayer
"I have uploaded tons of LAS files...
It is easy to learn the basics and display the data in a visually impactful way"
Michael Putnam. Independent Geoscientist. Texas, USA.∎
The GeolOil well log viewer allows to display log curves and core data value points easily in only four simple steps. You don't have to be an expert petrophysicist or geologist to produce top quality log displays:
- Step 1 : define tracks and select what curves will be displayed
- Step 2 : Define zones and stratigraphy: Markers, Formations, Members, Beds, Facies, Flow Units and more. Even the well completions
- Step 3 : Define the curve colors, strokes, thicknesses, threshold fillings, and crossover fillings
- Step 4 : Click to get your new log plot after seconds of uploading your well log LAS file
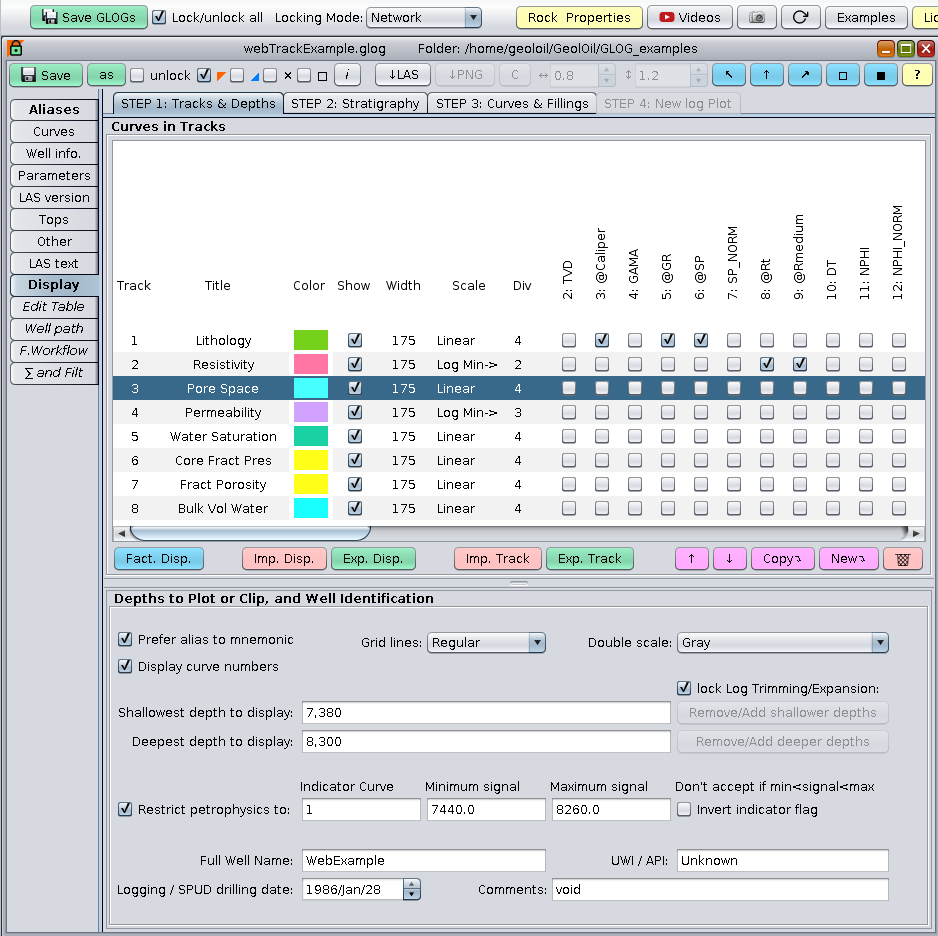
The Step-1 GeolOil tab to select tracks and curves to be displayed.
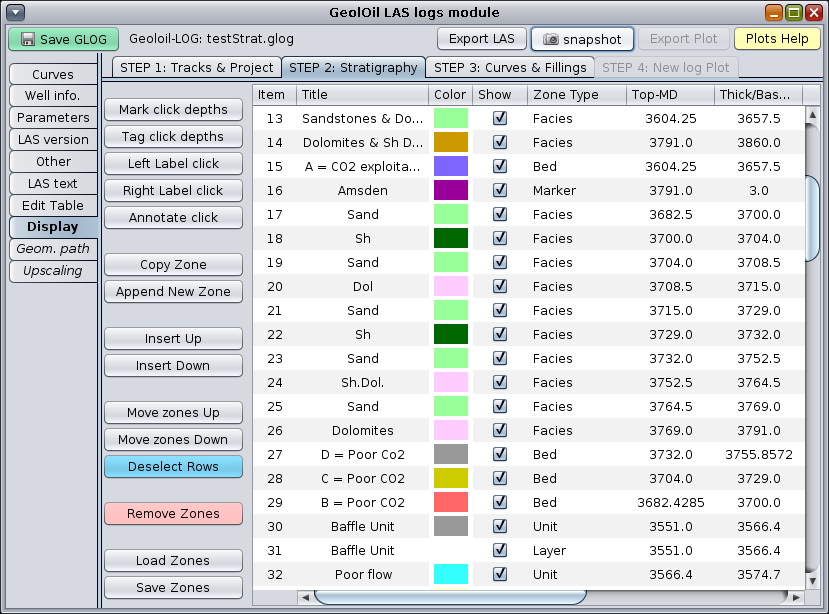
The Step-2 GeolOil stratigraphy tab
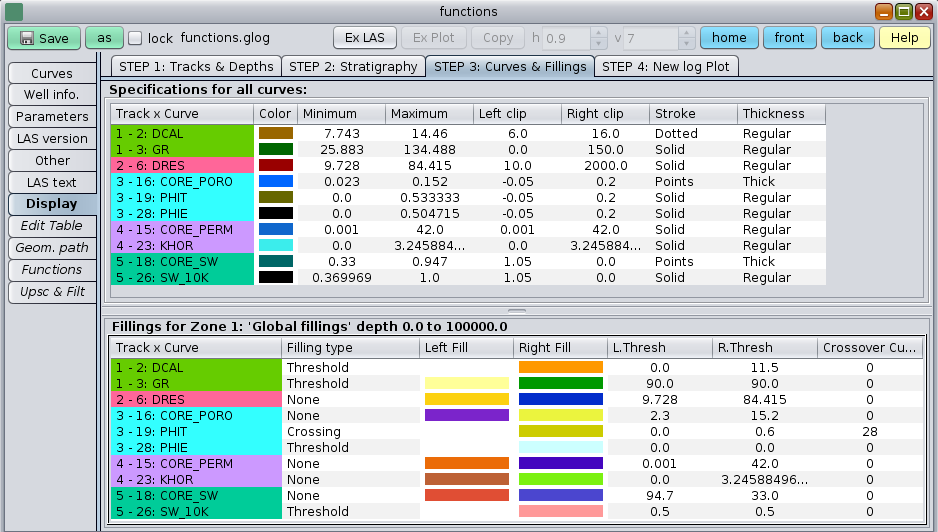
The STEP-3 GeolOil curves and fillings tab
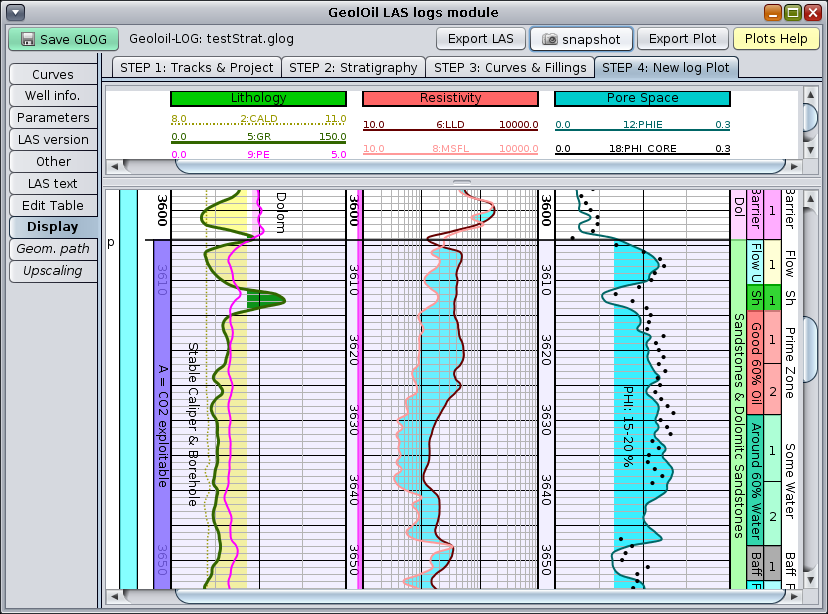
The final STEP-4 to get the log plot with stratigraphy and core data
Once a master display well log plot is created with its tracks, curves & colors, it can be exported, so other wells in the project can import and share the same log plot pattern. To do so, all the wells must use the same collection of aliases in a multi-well environment.
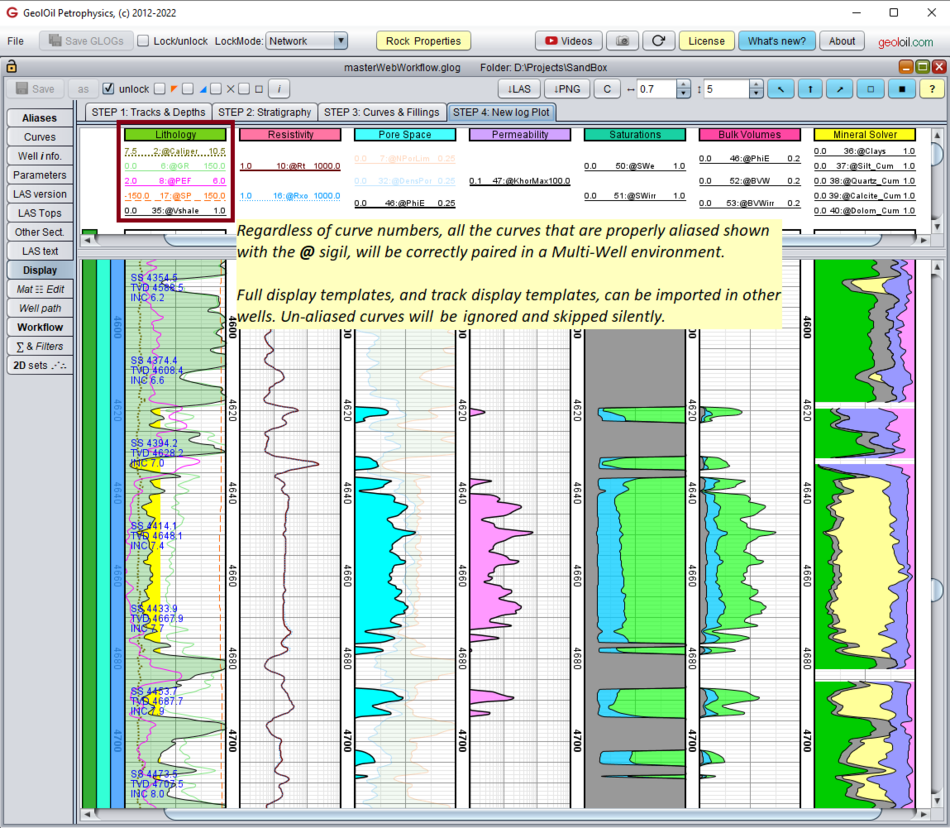
A display of a well log plot template in a multi-well environment
Other things that you can do with the GeolOil displayer are:
- Define tracks, log scale cycles, select curves for display, colors, strokes, curve fillings, and crossovers between curves.
- Highlight track backgrounds with transparency control
- Write text annonations on the log pane.
- Idependently control vertical and horizontal log zooms.
- Represent detailed stratigraphic zones in several vertical bars: Formations, Members, Beds, Facies, Flow Units, and Layers.
- Mouse based inmediate measure zones MD and TVD thicknesses.
- Mouse based inmediate reading of MD, TVD, and TVD-SS or TVD-AS for any depth.
- Mouse based inmediate reading of curve values
- Create a PNG image for your log, or export it to Power-Point or the clipborad with a single click.
- Access all the editing capabilities of the LAS well log file Editor module.
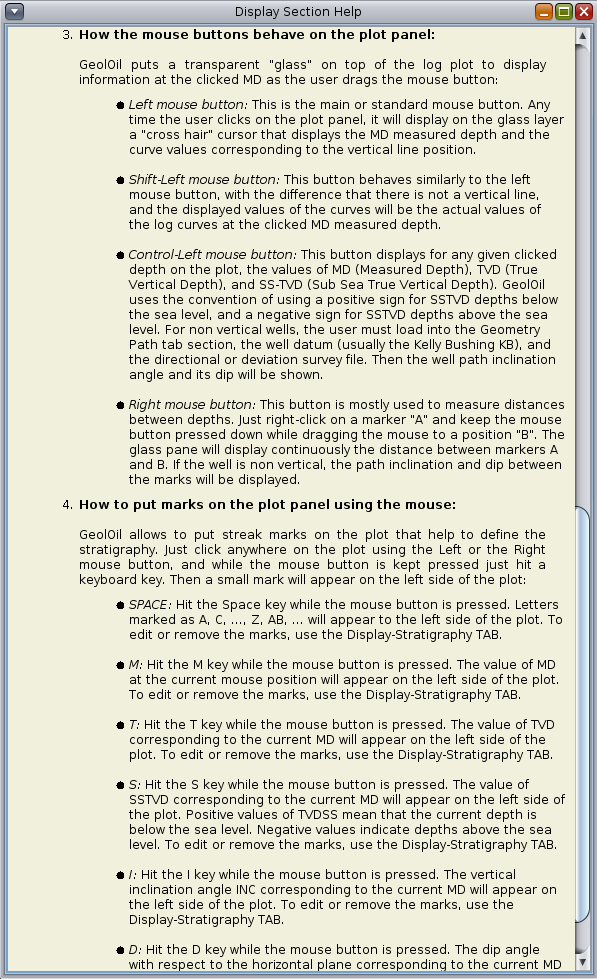
The GeolOil help display window

|
Related articles:
|

|
Related videos:
|
|
| |


|
|
|
© 2012-2026 GeolOil LLC. Please link or refer us under Creative Commons License CC-by-ND |