


 TRAINING


 PAPERS
 REFERENCES
 GET IN TOUCH

|

|
 Downloads
|
 Prices
|
 Videos
|


GeolOil - How to detect Gas caps from well log curves
By: Oscar Gonzalez, GeolOil LLC. This paper was first published on May 2020 on the website geoloil.com
The Gas Cap of a reservoir is the top zone that contains gases like methane CH4, ethane C2H6, carbon dioxide CO2, or a blend of gases. Because of gravity, gas accumulates in the top. Beneath the pure gas zone, a transition zone with gas and oil may appear, then an oil zone, an oil-water transition zone, and finally a pure water zone, occasionally an aquifer. The Water Oil Contact WOC, is the shallowest depth for which 100% of effective water saturation SWe is found.
Because of gases high compressibility, thick gas caps help to maintain reservoir pressure. There is no free movable water in the pure gas zone, but water can be present as bounded water and connate water saturation.
Connate water saturation is the irreducible water saturation that is found in a reservoir in its natural conditions of pressure, temperature, and wettability. Irreducible water saturation is the trapped non-mobile water saturation measured in a laboratory with capillary pressure tests at desired controlled conditions of temperature and pressure that not necessarily matches the reservoir conditions.
Eventually, the irreducible water saturation in the lab can be quite small if enough pressure is applied. That's why the capillary pressure tests should be run as closely as possible to the natural in-situ reservoir conditions to measure the correct value of the connate water saturation.
GeolOil software provides three main methods to detect gas caps:
1. The difference on the porosity estimates between neutron porosity and density porosity.
2. The estimation of the fluid transit time ΔTf through sonic logs.
3. A change on the slope of the vertical stress.
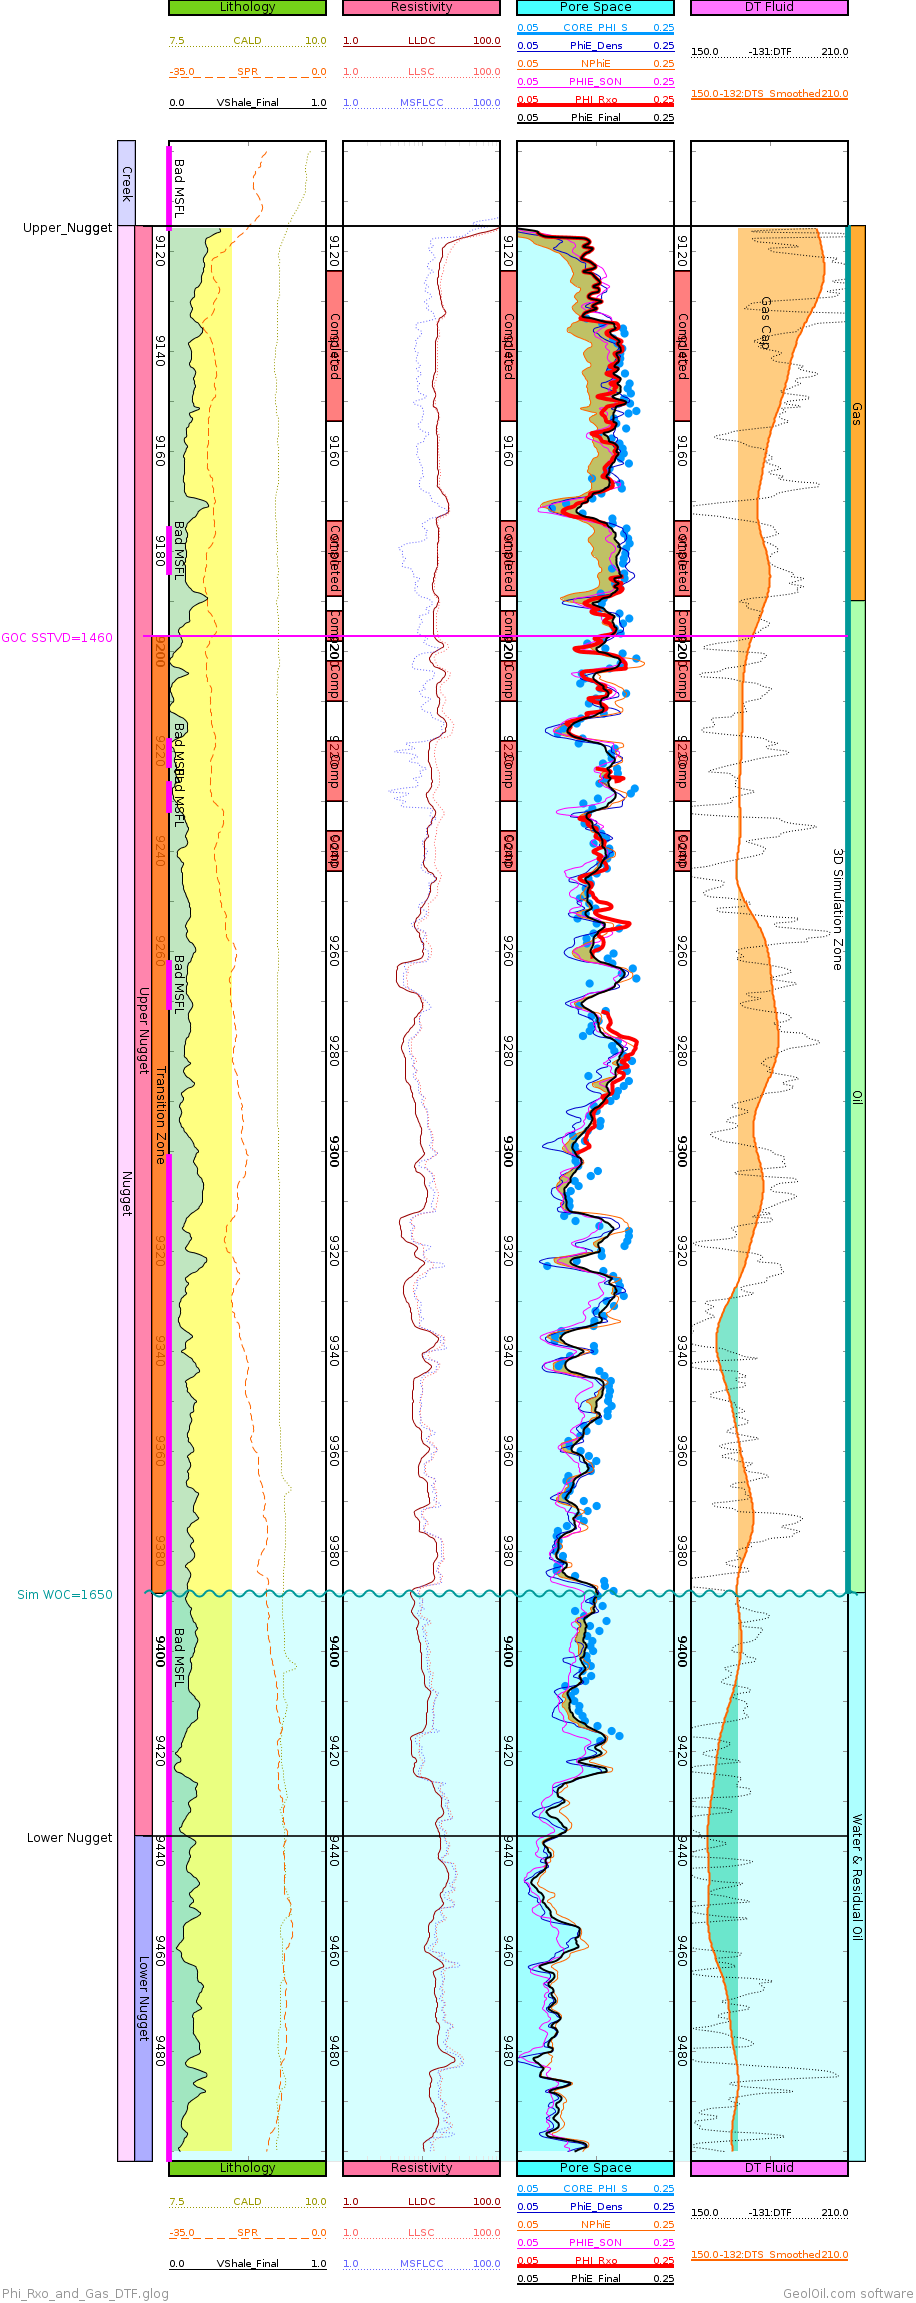
A gas cross-over between neutron porosity and density porosity, and an increase in the fluid transit time
✔ NOTE: The GLOG file work-flow for this log is available for download with the set of optional interpretation examples.
-
The difference on the porosity estimates between neutron porosity and density porosity (called gas cross-over)
In the presence of gas on clean reservoirs, the neutron porosity under-estimates the volume of the pore space. This is because the neutron porosity log is not a direct measurement of the porosity itself, but essentially responds to the amount of hydrogen molecules in the reservoir. Since the gas molecules have larger separation distances than in liquids, fewer proton counts from hydrogen atoms of methane CH4, ethane C2H6, or blends with carbon dioxide CO2 are detected.
Clean rock matrices with calcite CaCO3 (limestones), quartz SiO2 (clastic sandstones), dolomites CaMg(CO3)2, and combinations, don't contain hydrogen. If the rock has clays, there is presence of hydrogen in the clay formulas and the neutron "porosity" increases due to the excess of hydrogen, so a careful correction to remove the clay response from the neutron porosity signal is needed. Also the neutron porosity curve must be converted from the usual calibrated limestone matrix to the correct reservoir matrix mineralogy.
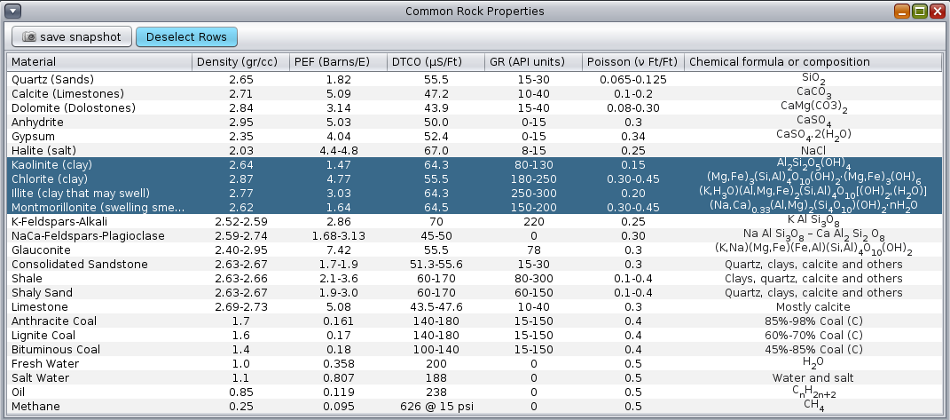
A table showing clay chemical formulas with hydrogen content
On the other hand, the density porosity may slightly over-estimate the porosity in the presence of gas:
If a default fluid density around 1.0 grams/cc is used instead of the correct lower ρfluid
fluid density in the pore space close to the wellbore wall —a mix of the mud filtrate and gas
seen by the bulk density tool—, the density porosity φDensityT will be over-estimated
from the bulk density equation φDensityT = (ρmatrix - ρbulk)
/ (ρmatrix - ρfluid) = φTotal.
The combined effects or an over-estimated density porosity, and an under-estimated neutron porosity, generates
the classic porosity cross-over effect seen on log plots. In the figure above, it is the orange fill
on the pore space track. If the bulk density curve is not available or not reliable, a cross-over between
the neutron porosity and a φRxo
porosity estimate from the flushed zone resistivity might work
—the thick red curve on the log plot above—.
-
The estimation of the fluid transit time ΔTf through sonic logs
Gas molecules have larger separation distances than those of liquid molecules. This causes that the speed of the sound in gas is slower than in liquids or solids. Hence, the fluid sonic transit time ΔTf will be larger in gas than in liquids or solids.
Once an unbiased and reliable estimate for the porosity is computed —with techniques like φRxo, Raymer porosity, or a combined robust estimation from neutron and density porosity—, the fluid sonic transit time ΔTf can be estimated with the Willie equation. The log plot above shows in the last track "DT Fluid" an orange filling that reasonable matches the zones with gas cross overs.
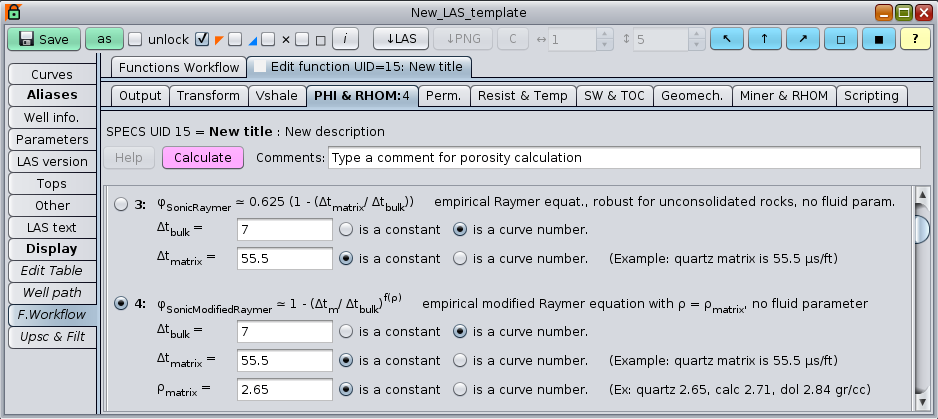
GeolOil panel window to compute Raymer sonic porosity
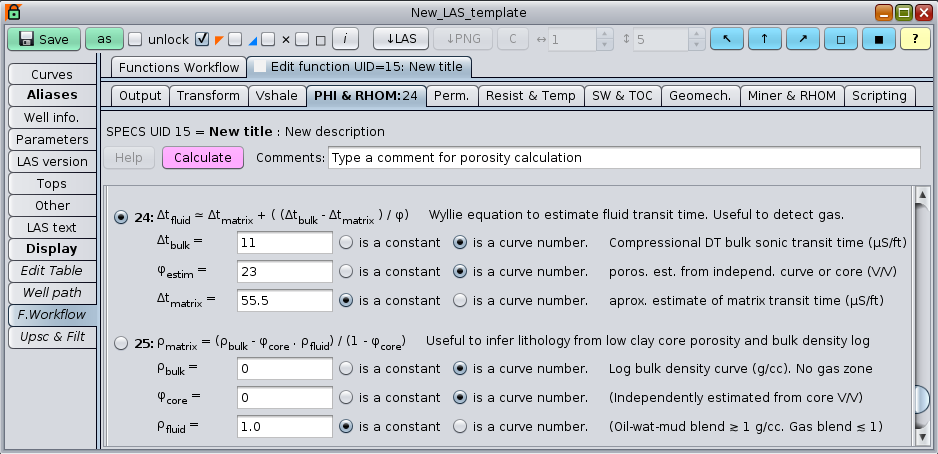
GeolOil panel window to compute fluid transit time ΔTf
-
A change on the slope of the vertical stress
Gases are less dense than liquids. Hence, the bulk weight of a reservoir with a gas cap is smaller than the weight of the same reservoir filled with liquids. So, the overburden vertical stress gradient or slope should change underneath the gas cap zone. That change of slope might be seen if the gas cap is thick enough:
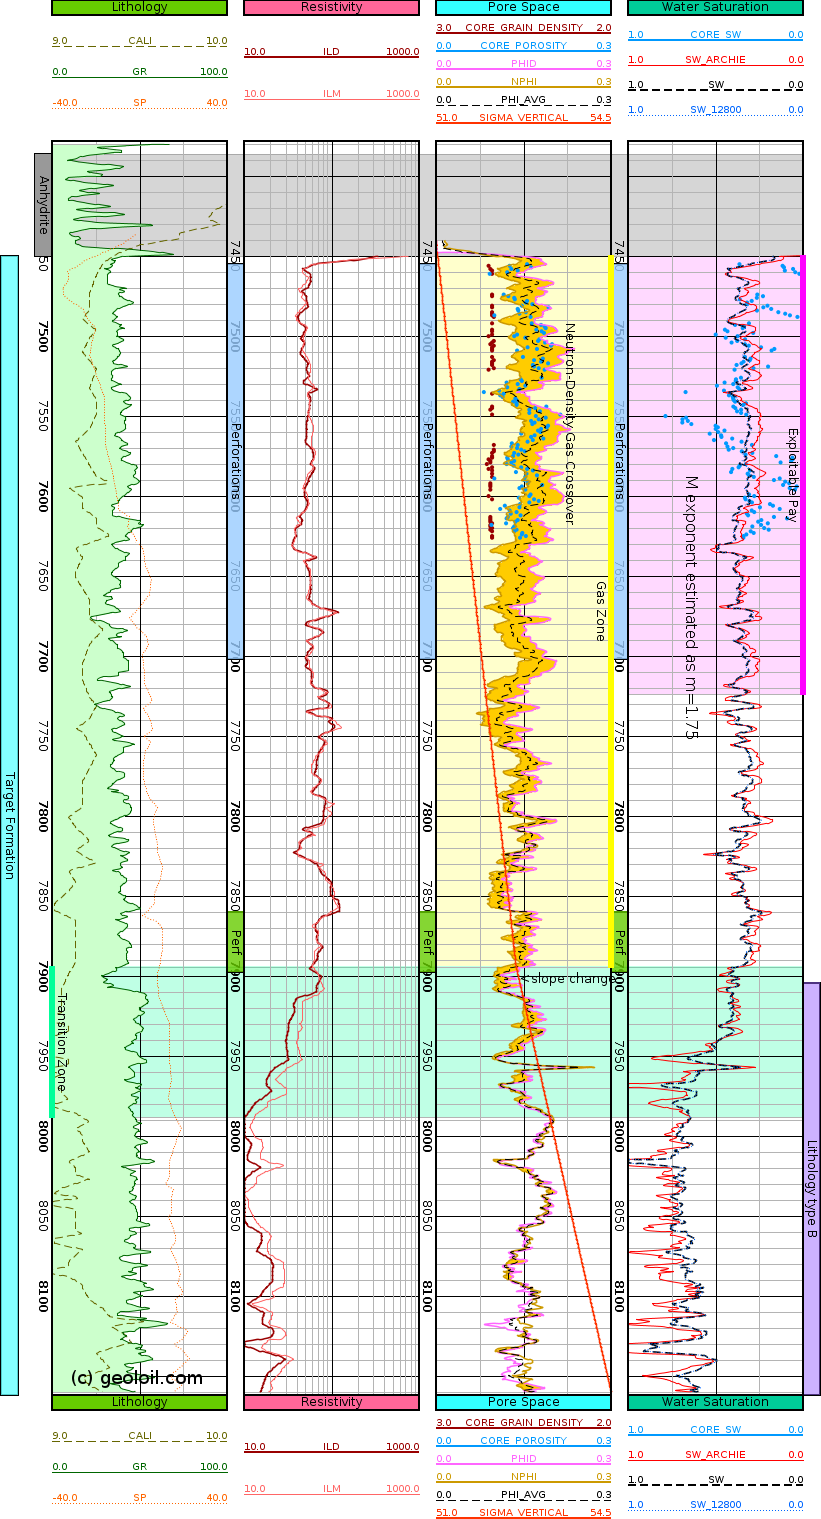
The total vertical stress and its slope change around the gas cap
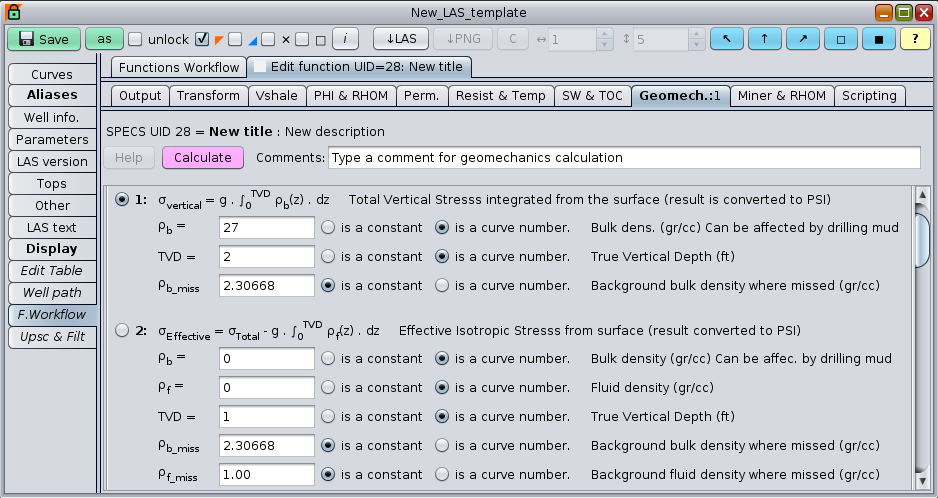
The GeolOil geomechanics panel to calculate vertical stress
![]() The neutron porosity log provides similar readings in clean rocks with oil or water (but not in gas, as discussed before).
The neutron porosity log provides similar readings in clean rocks with oil or water (but not in gas, as discussed before).
As an example take alkane hydrocarbons. Their generic chemical formula is CnH2n+2.
For a hydrocarbon molecule chain having n ≥ 10 Carbon atoms, there will be ≥ 22 Hydrogen atoms.
A corresponding set of n ≥ 10 molecules of water H2O has ≥ 20 Hydrogen atoms. So hydrocarbon
may have around ≤ 10% more hydrogen atoms —the ratio (2n+2)/(2n)—
However, hydrocarbons have a larger average separation distance between Hydrogen atoms than those of water,
which helps to volumetrically compensate the hydrogen count.
Also, the inclusion of irreducible and free water with oil,
makes the fluid mix to have the same porosity reading for practical purposes.
As a matter of fact, on clean reservoirs, both neutron and density porosities provide essentially
the same estimates either in aquifers or oil zones.
The neutron porosity tool has a deeper formation
penetration that the bulk density tool. So if properly processed, a quality neutron porosity curve is a
valuable measure, more robust against borehole wall rugosities than the bulk density tool.

|
Related articles:
|
|
| |


|
|
|
© 2012-2026 GeolOil LLC. Please link or refer us under Creative Commons License CC-by-ND |