


 TRAINING


 PAPERS
 REFERENCES
 GET IN TOUCH

|

|
 Downloads
|
 Prices
|
 Videos
|


GeolOil - Petrophysical Summaries and well log Upscaling
"One of the functions that I find to be extremely useful is the ability to set up
flow units and layers, and upscale the log curves to each layer"
Brian Black. Owner and Geologist. Black Petroleum Resources, LLC. Utah, USA.∎
GeolOil has a module to upscale petrophysical properties for well logs (Think of upscaling as the process to assign a summary or equivalent value). The module can compute upscaled values for intensive and extensive properties, like:
- Net reservoir thickness.
- Net-Pay thickness.
- Isochore Thickness.
- Net to Gross Ratio.
- Porosity in reservoir rocks, pay rocks, and gross rocks.
- Water Saturation.
- Shaliness of sandstones.
- Formation Water Resistivity by the Hingle algorithm.
- Cementation exponent m.
- Percentiles of a property.
- Dykstra-Parsons vertical heterogeneity
An Intensive property, is a physical property for which its summary, upscaled or representative single value does not depend upon the sample size or overall volume. Classical examples of intensive properties are density, porosity, and water saturation. Extensive properties inherently depend upon the sample size or volume.
Examples of extensive properties are equivalent hydrocarbon column (depends upon the zone's thickness), and bulk volume of water. Likewise, reservoir properties like net-reservoir thickness, net-sand thickness, and net-pay can be considered as special cases of extensive upscaling computed on the summation of indicator lithotypes. Generally speaking, average types are related to intensive upscaling, and totals or nets are related to extensive upscaling.
Each upscaling have its own combination of computation type, lithology or facies definition, stratigraphy, and the layers or vertical cells where it will be computed. The resulting upscaled values or summaries, can create a staircase style curve to display and compare the results against the original curve.
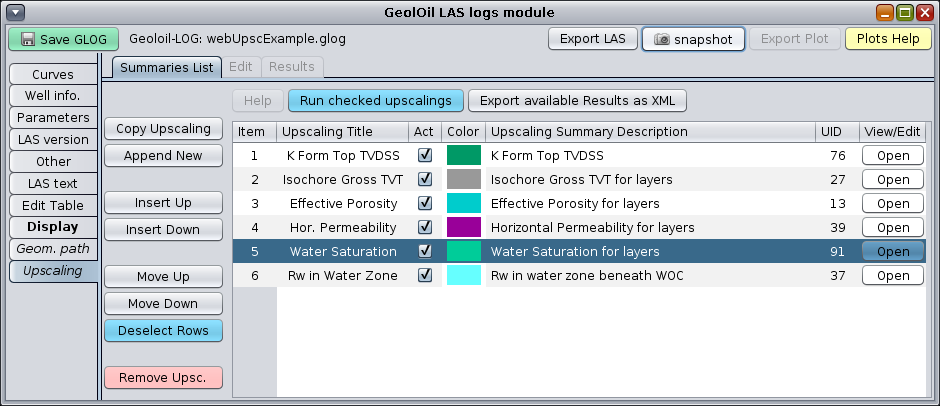
The main upscaling list panel, with SW upscaling highlighted
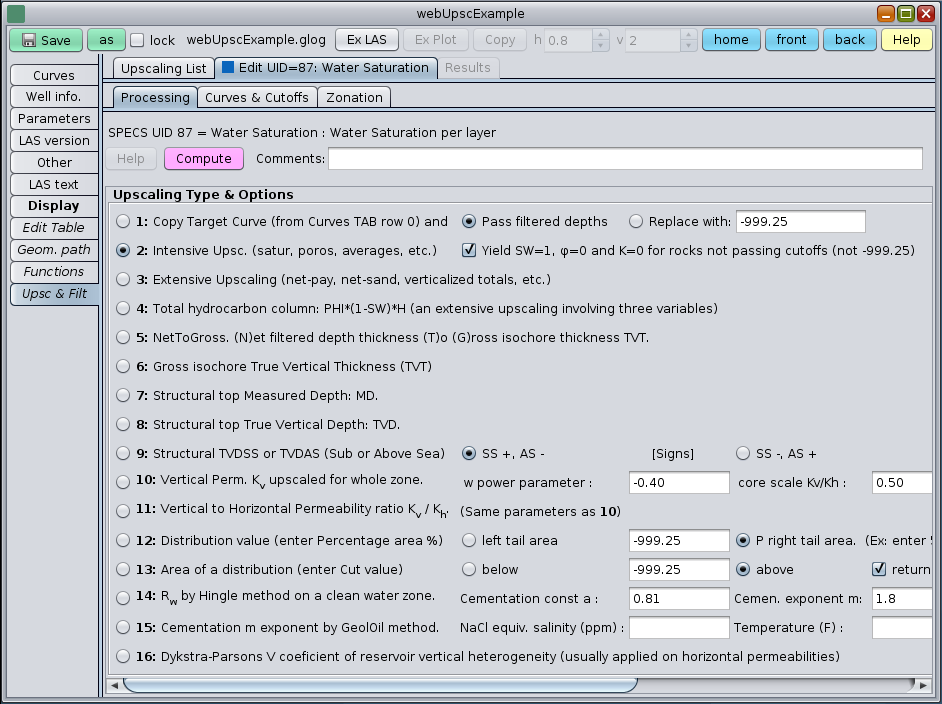
The upscaling processing panel. Notice that Water Saturation SW is computed as an intensive upscaling.
GeolOil allows to define lithology types in several ways. There can be available indicator flag curves for lithologies and facies, or the user can define a lithology through a series of filters and cutoffs. For instance, gross rocks should not be filtered, so the whole column should be accepted. Likewise, lithologies like clean sandstones should be filtered by a low Gamma Ray curve signal (for example, GR below 65 units API) and photoelectric factor PEF of around 1.9 B/E units. Limestones should be filtered by PEF curve values around 5 B/E units, etc.
The processing panel should be filled with all the relevant curves needed for the computation. For example, if the upscaling of water saturation on gross rocks is desired, the user must specify the curve numbers both for porosity and water saturation (since correct SW upscaling depends not only on SW itself, but also on its porosity). Also, the target property (row item 0) must have the same water saturation curve number. This is how GeolOil knows the right equations to upscale water saturation.
Treatment of outliers can be specified in the processing panel. For instance, if the user needs to upscale porosity, what is the best processing treatment that has to be done for negative values?. Clearly, negative values for porosity should not be allowed to enter into the computations. A negative outlier value might be rejected (discarded and thrown away), or trimmed (converted to a value of 0.0). The user also has options to discard unreliable depth zone intervals.
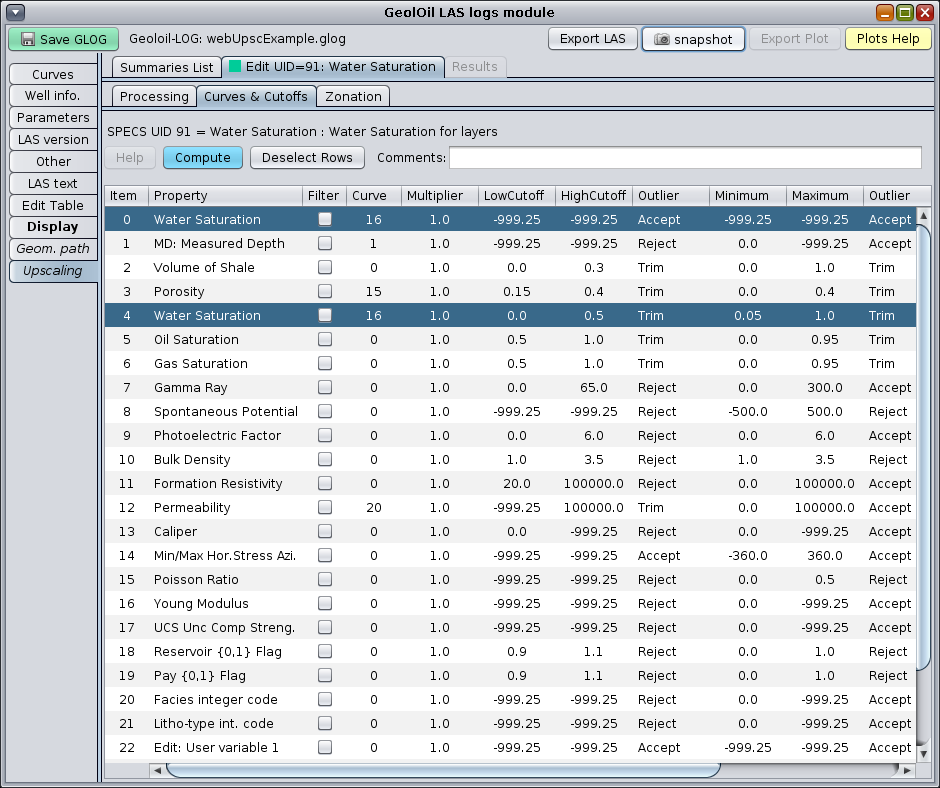
The curves and cutoffs filtering panel.
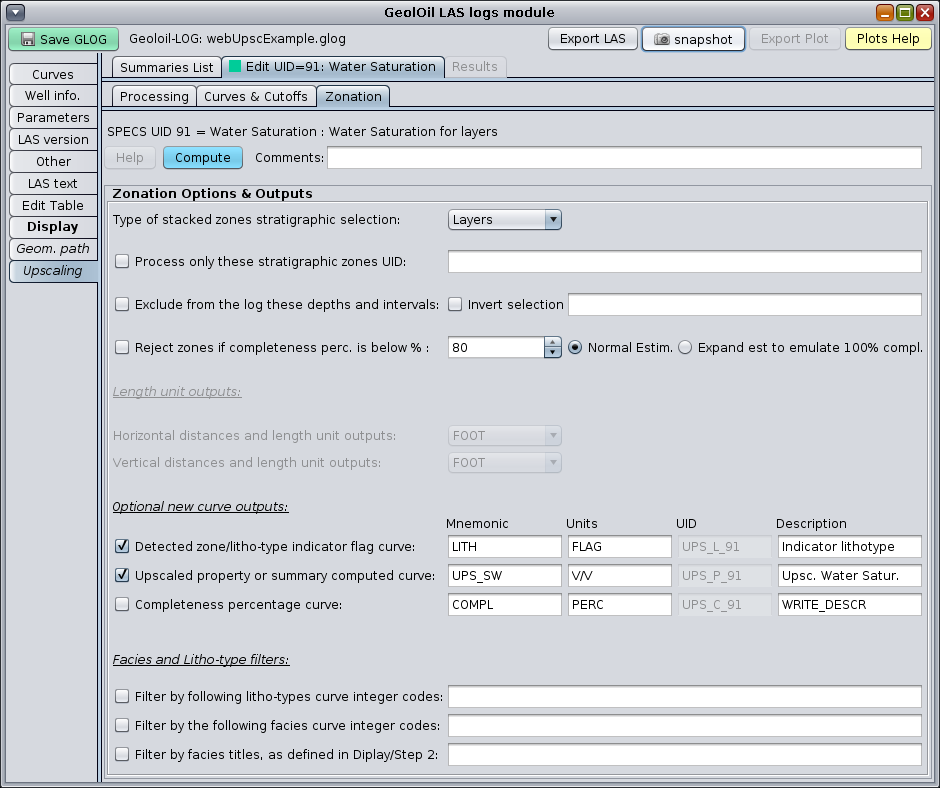
The zonation panel, where curve outputs can be defined and additional zone filters applied
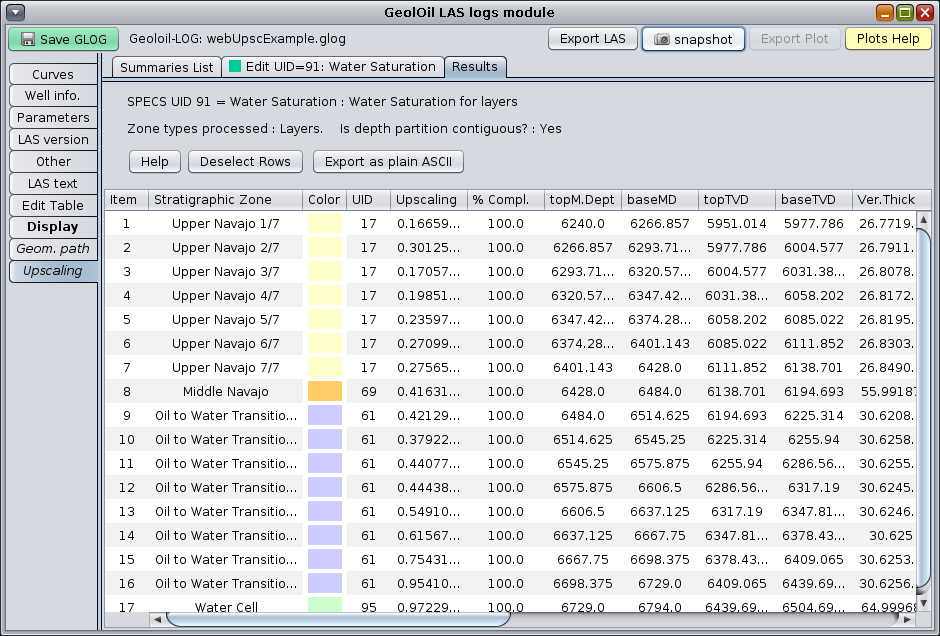
The results panel, where upscaled values are tabulated for each layer or cell zone
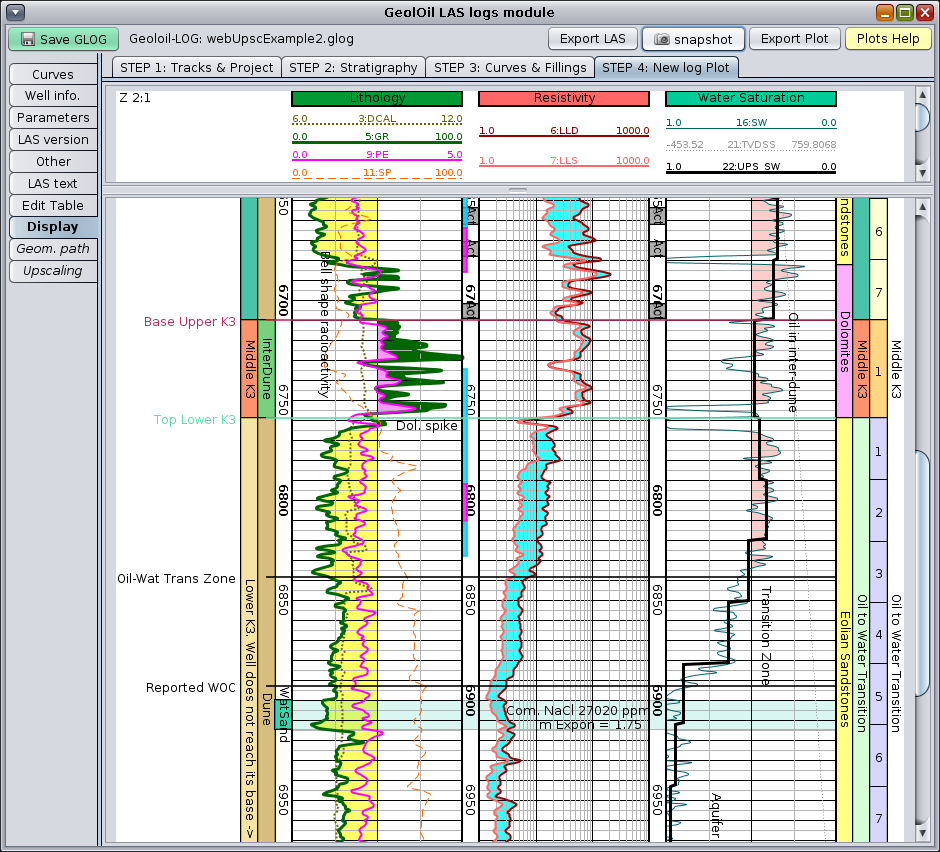
The figure below shows the plot of an upscaled SW curve (UPS_SW), shown in black with a staircase steps pattern

|
Related articles:
|

|
Related video:
|
|
| |


|
|
|
© 2012-2026 GeolOil LLC. Please link or refer us under Creative Commons License CC-by-ND |