


 TRAINING


 PAPERS
 REFERENCES
 GET IN TOUCH

|

|
 Downloads
|
 Prices
|
 Videos
|


GeolOil - How to estimate RHOM Matrix Density estimation from well logs
The matrix density or a rock (RHOM or ρm), is the density (mass/volume) of all collected solid components of the rock. This must exclude all connected or unconnected inner pore spaces and their fluids, and trapped fluids inside some minerals like clays. Hence, the rock matrix consists only of the frame of rock grains, the cements that join them, and dry clays.
Before discussing how to estimate RHOM or ρm, the concepts of total pore space, total porosity, effective pore space, effective porosity, and bulk density of a rock must be defined:
- The total pore space of a rock is the total volume of all connected, unconnected inner pore spaces, vug cavities, and fractures —regardless of fluids that may be tightly stuck inside clay tiny pores, or surrounding fluids coating rock grains thorough irreducible fluids— The rock's total porosity (PHIT or φt), is defined by the total pore space volume divided by the gross rock volume.
- The effective pore space of a rock is the total volume of all connected pores of the rock. Thus, the effective pore space is the total pore space, minus the volume of all unconnected pore spaces that carry fluids inside. The rock's effective porosity (PHIE or φe), is defined by the rock effective pore space volume divided by the gross rock volume.
- The bulk density of a rock (RHOB or ρb), is the total mass of rock (including rock solids like grains, cements, dry clays, and all fluids —regardless if such liquids or gases are trapped or movable—), divided by the grosss volume of the rock.
Once a well log has a curve of bulk density RHOB or ρbulk, the total porosity from densities φDensityT can immediately be calculated if the matrix density RHOM or ρmatrix, and the fluid density ρfluid estimates are known: φDensityT = (ρmatrix - ρbulk) / (ρmatrix - ρfluid)
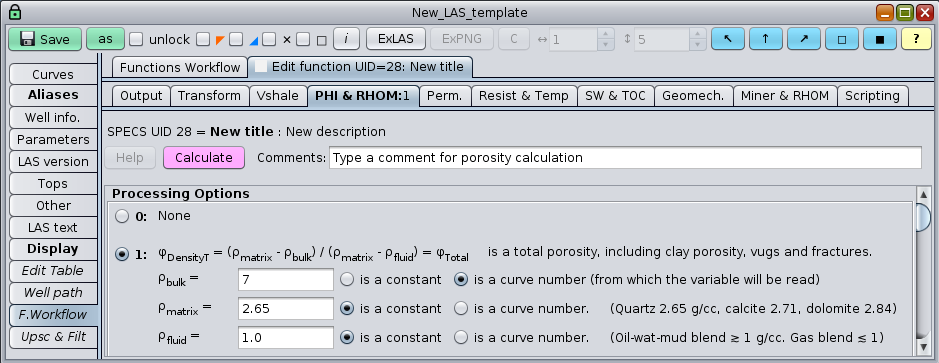
The GeolOil Petrophysics Software panel to compute total porosity
→ How can RHOM ρm be estimated?
There are three major techniques to estimate it:
• Using direct laboratory core measurements. ⚠
• Using techniques 100% based on well log curves. ✔
• Using techniques that combine both core data and log curves. ✔
-
Using direct laboratory core measurements.
A rock sample is taken to the lab, cleaned, dried, and crushed. Then the rock solid remain parts are collected and the density is measured. A straightforward approach, the measurement specified by its formal definition. However it has severe reliability drawbacks:
- The sample is not measured in-situ. The core or wall sample is physically extracted from the formation and brought to the lab. This involves changes on the geomechanical stress conditions, which might alter porosity, permeability, and induce fractures due to expansions, contractions, and stress fatigue. The rock is no longer the same.
- The sample probably suffered from some invasion fluids and even tiny solid debris and drilling fluid particles. This is almost unavoidable, and furthermore the invasion changes the fluid saturations. Specially, the water saturation is affected, and occasionally yields a larger SW when compared to an invaded rock.
- Unless a full core is taken and studied, the core sample representativeness is biased. Normally, the samples measured are the nicest samples with better consolidation, physical integrity, and within pay intervals on target lithologies. The whole reservoir column is sparsely sampled, with poor coverage for log petrophysical interpretation, and to build 3D simulation models.
- In spite of its clear conceptual definition, the lab protocol is delicate. For instance, cleaning the rock with toluene may alter the rock's wetability and fluid-rock interaction. A careful controlled drying process is needed. If there are even minimal remnants of water inside the clay tiny pore spaces, the final matrix density will be smaller than it should be. This is because the density of dry clays are much higher than the density of its water inside (around 1.0 gr/cc). The figure below highlights typical densities for dry clays:
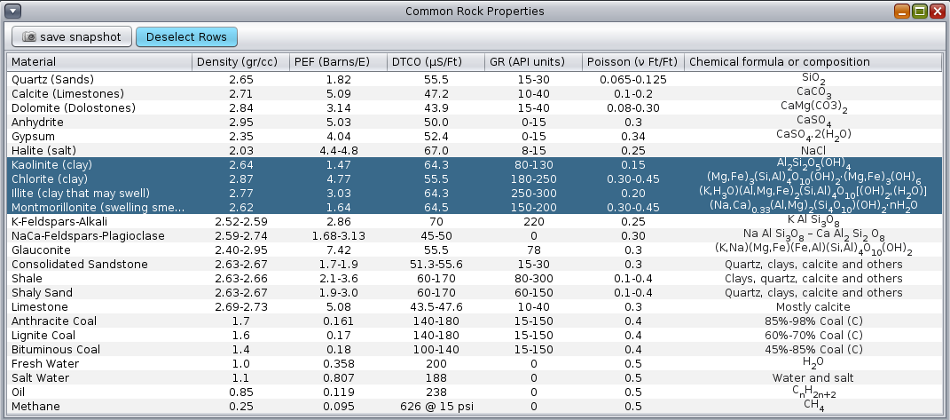
A table showing typical rock properties ↓
-
Using techniques 100% based on well log curves.
These techniques should be in the toolbox of all petrophysicists, as they provide in-situ estimates of the RHOM matrix density ρm. As long as the log curves have good quality, the results may be reliable, consistent, and accurate. Furthermore, they provide a continuous curve estimate of the matrix density RHOM as a function of depth. That is, ρm = ρm(depth), instead of a sparse collection of measurements on the core individual sample depth points.
GeolOil software Functions Workflow provides two ways to estimate RHOM using log curves only: The use of mineral solvers, which solve mineral proportions and outputs RHOM, and the contrast behaviour difference between neutron porosity and density porosity —after clay corrections— The two figures below show panels that can compute RHOM from a mineral solver, and from neutron porosity versus density porosity contrast.
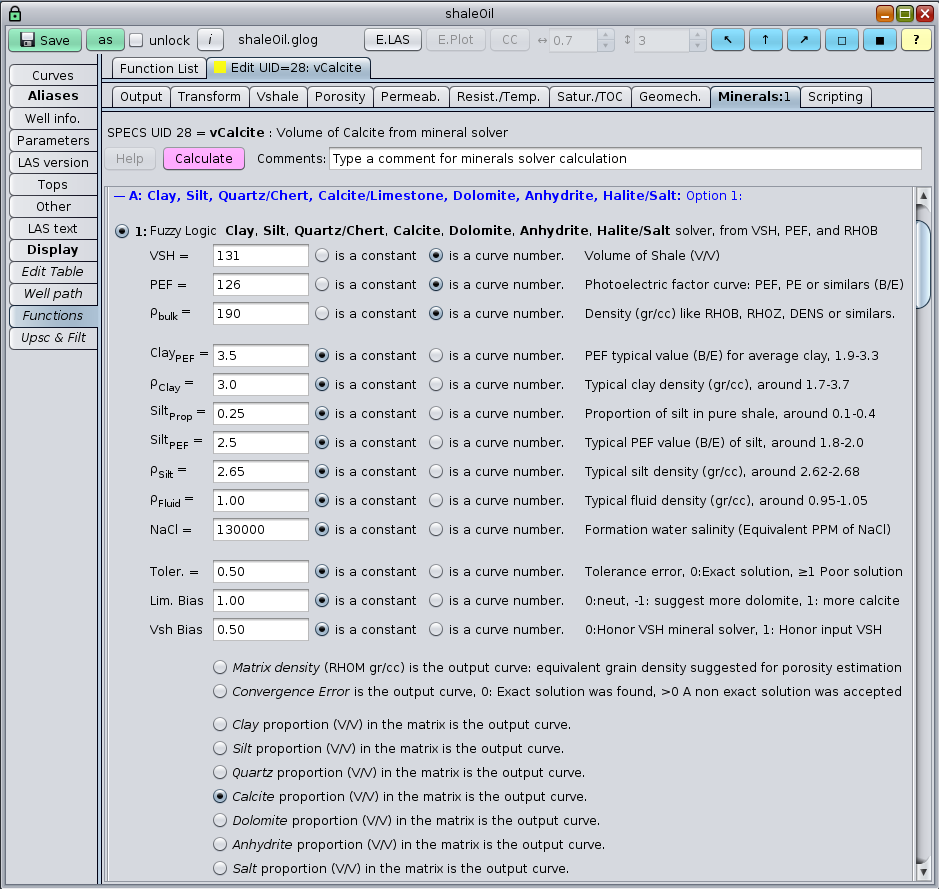
The GeolOil mineral solver panel for clays-carbonates.
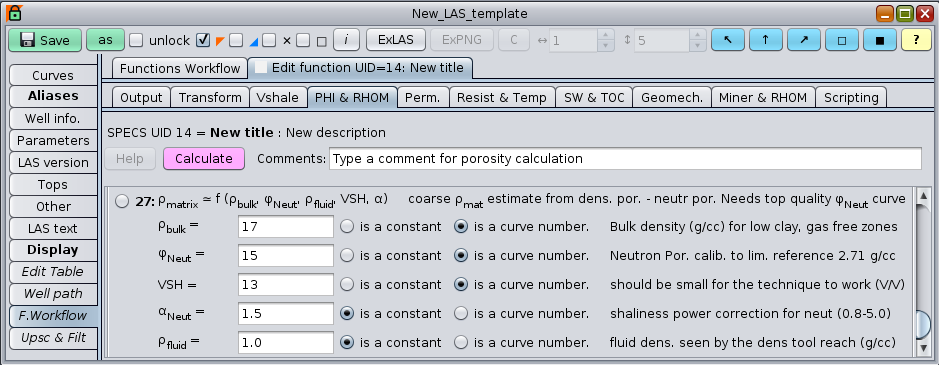
The panel to estimate RHOM from neutron porosity and bulk density
The figure below allows to compare how close are the two RHOM estimates by the mineral solver, and the neutron to density contrast technique. The very last brown track, called "RHOM Matrix" shows in a blue curve the RHOM estimate found from mineral solver. The thick red solid curve shows the estimate by the neutron to density contrast. The mineral solver does a better job estimating RHOM (it uses more information) where the neutron to density contrast technique fails to produce an estimate. However when both techniques succeed to produce estimates for RHOM, they are quite close.
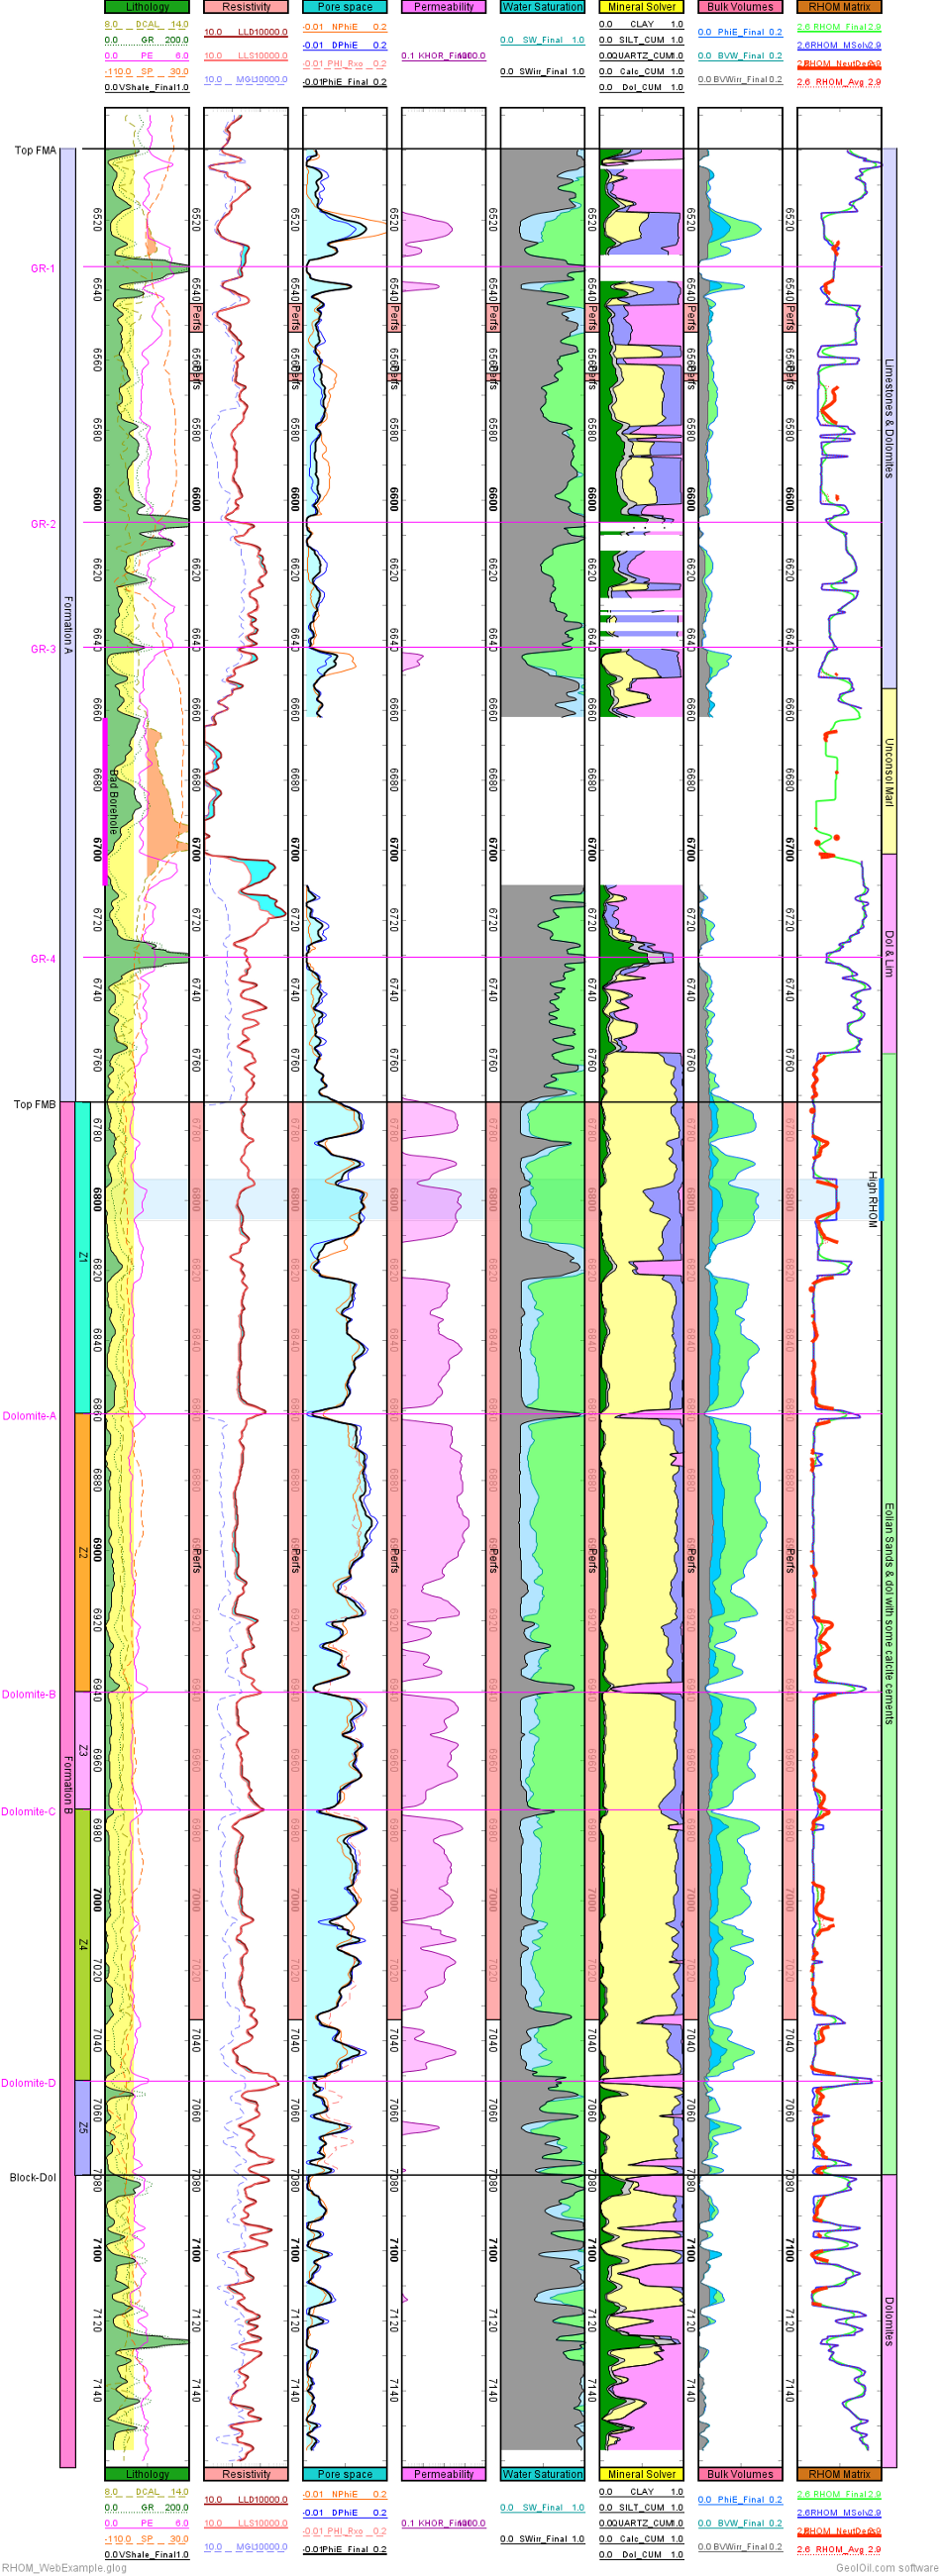
A log plot with RHOM estimates through a mineral solver and neutron to density contrast
✔ NOTE: The GLOG file work-flow for this log is available for download with the set of optional interpretation examples.
-
Using techniques that combine both core data and log curves.
When a well log has also a companion core data set, it is advisable to combine both sources of information to produce an unified consistent estimate of RHOM. GeolOil provides several formal methods for such estimates. In spite that core plugs are usually measured for sizes of around few inches, and the log curves represents around a coarser 1 foot of resolution scale, the average trend of noisy core data measurements and its heterogeneities, may have a reasonable agreement with the logs estimates. The panel below shows some options to estimate matrix properties:
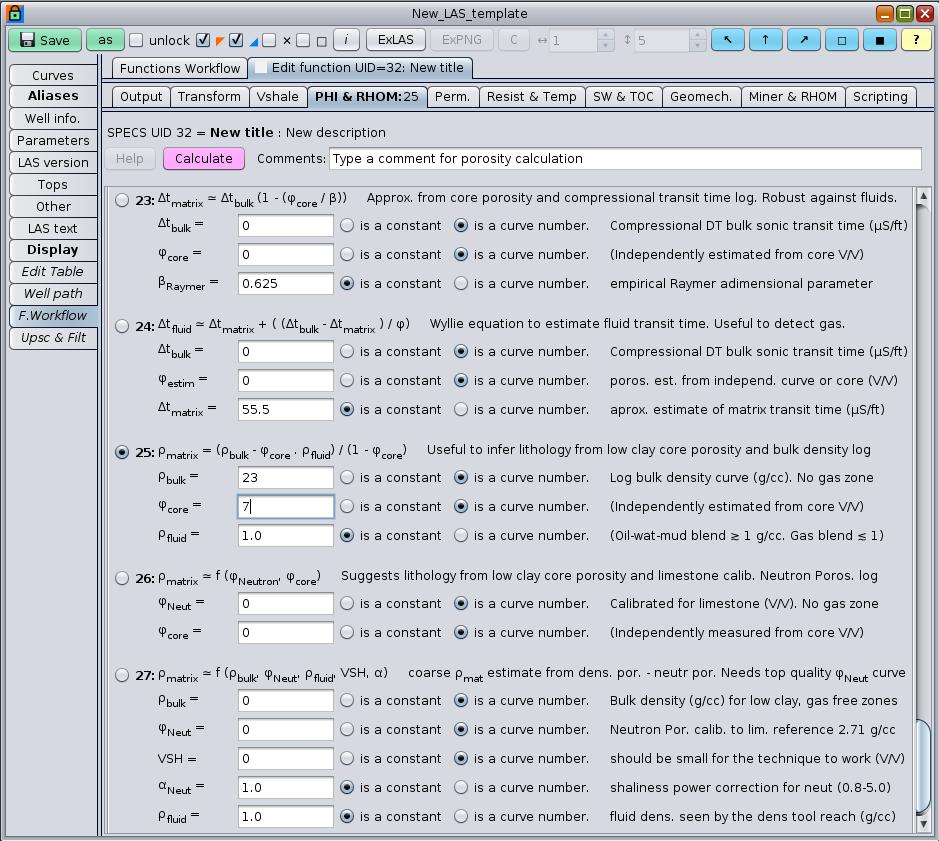
The GeolOil panel to compute matrix properties from core and log curves
The next figure below shows a log plot where the matrix density RHOM was estimated combining the curve bulk density RHOB
from the log, and the core porosity lab measurements (function 25 above).
This is a different well from the former log plot example, which lacks of core data,
yet the combined data source technique successfully detects the correct depths for the high density dolomite markers, even without using
a mineral solver like the former well.
At the rightmost last track, the blue dots are the estimated matrix density values at core depths. The continuous blue curve is the kernel smoothing of such estimates. The continuous brown curve is the estimate of RHOM using the neutron to density contrast (as the former well). Notice the good agreement between the brown RHOM curve and the blue RHOM curve. The final black RHOM curve is the average between the brown and the blue curves.
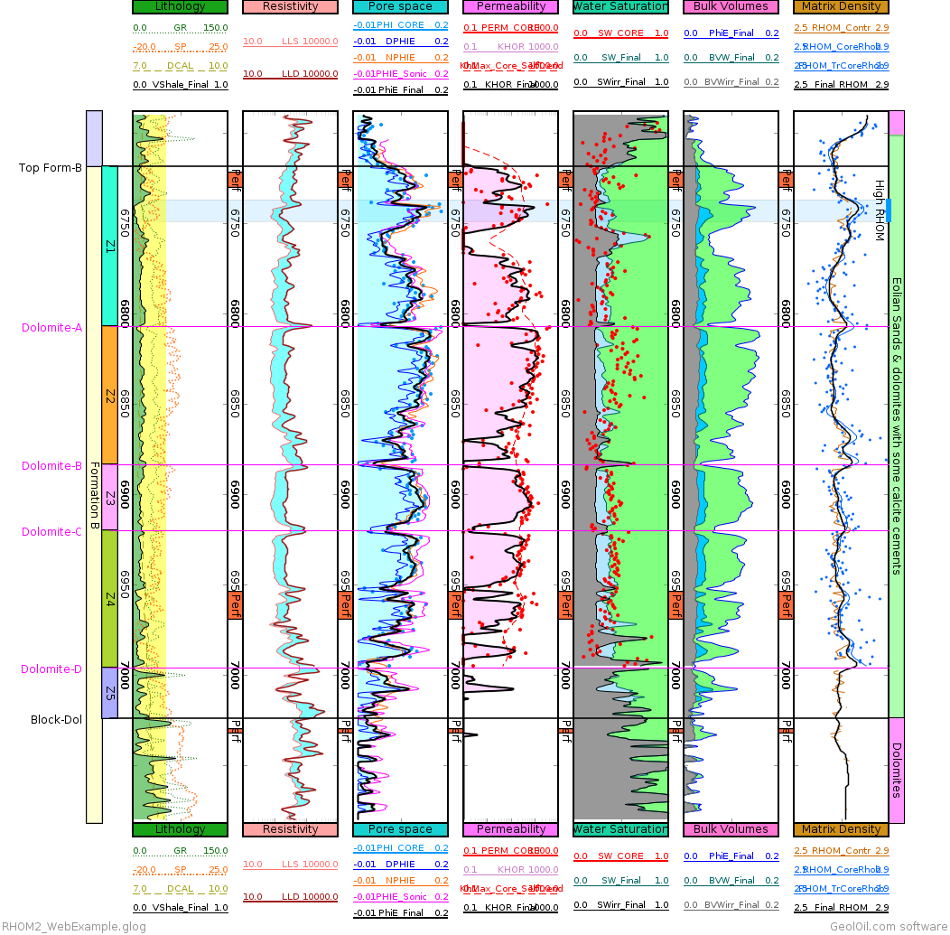
A log plot estimate of RHOM combining core porosity and the log curve of bulk density

|
Related articles:
|
|
| |


|
|
|
© 2012-2026 GeolOil LLC. Please link or refer us under Creative Commons License CC-by-ND |