


 TRAINING


 PAPERS
 REFERENCES
 GET IN TOUCH

|

|
 Downloads
|
 Prices
|
 Videos
|


GeolOil - How to calculate Petrophysicals Cutoffs
 This is one of our most referenced articles on the internet:
★ It is the standard default technique to compute original mobility cutoffs for
volume of shale, porosity, and water saturation.
★ It has inspired or influenced the year 2016 French Patent FR3024490A1 —Granted status, expiring on the year 2034—
★ It has inspired or influenced the year 2019 multi-national European Patent EP 31752674 A4 20180418 —Granted Status—

Many reservoir studies use legacy or former petrophysical cutoffs already computed. However, you may want to validate those VSH, PHIE and SW cut-offs, or even estimate or calculate suitable cutoffs for a new formation or members under study. There are several techniques or criteria to define cutoffs from a production point of view. This section illustrates the Cumulative Hydrocarbon Column technique.
The concept of the equivalent hydrocarbon column in a formation is simple: HCOL = PHIE * (1-SW) * Delta_H, is the equivalent height of pure hydrocarbon column contained in a zone of thickness Delta_H > HCOL, when poured into a recipient:
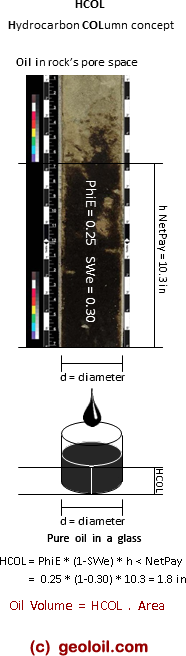
The concept of equivalent hydrocarbon column
Clean rocks with low Shale Volume VSH or Vshale usually have few problems or capability to store hydrocarbons. As a rock becomes more shaly, it will be more difficult either to store hydrocarbons, or the hydrocarbon to migrate from the source rock to be trapped into the reservoir. There is an elbow point of VSH beyond which there are no more significant contributions to store or migrate hydrocarbons. That point could be taken as a VSH cutoff for pay rocks. The same concept applies for effective porosity PHIE (and also permeability), there is a threshold point of tight porosity with a low capability to store or migrate hydrocarbons.
The sequential algorithm can be summarized as follow:
-
STEP 1: Seek the elbow point for VSH
Define the top and base of the interest zone. Compute the hydrocarbon column for all log steps without any restrictions. Then apply regular decreasing values of VSH_cutoff (that is, scan from right to left, like VSH_cutoff = 100%, 95%, 90%, ..., 0%) and compute the total hydrocarbon column, rejecting rocks for which VSH > VSH_cutoff. A plot of pairs {(VSH_cutoff, HCOL)} would show the elbow point to pick a VSH cutoff value.
Why do we scan VSH_cutoff = 100%, 95%, ..., 0% from right to left? When we start with a VSH_cutoff = 100%, we accept all rocks with VSH≤100%. Since VSH≤100% is always true, we are accepting all rocks, both sealing rocks and pay rocks. No rock is discarded and the total hydrocarbon column reaches its maximum possible value.
When the VSH_cutoff is decreased slightly, we start to reject very shaly sealing rocks that don't bear much oil, so the total hydrocarbon column is almost the same (the plateau). As VSH_cutoff is decreased more and more, most of the shaly rocks non bearing oil are rejected and the elbow point is reached (the end of the plateau). This is the VSH value for which the oil succeed to migrate and accumulate. As VSH_cutoff approaches 0, even the cleaner pay rocks are discarded and the total hydrocarbon column approaches 0. -
STEP 2: Seek the elbow point for PHIE (or even permeability)
Keep and freeze the VSH elbow cutoff value VSH_cutoff picked in Step 1. Then compute the total hydrocarbon column while scanning from left to right the effective porosity cutoffs 0%, 5%, 10%, etc., accepting only those rocks for which (VSH < VSH_cutoff) and (PHIE > PHIE_cutoff). A plot of pairs {(PHIE_cutoff, HCOL)} would show the elbow point to pick a PHIE cutoff value.
Why do we scan PHIE_cutoff = 0%, 5%, ..., from left to right? When we start with a PHIE_cutoff = 0%, we accept all rocks with PHIE≥0%. Since PHIE≥0% is always true, we are accepting all rocks, both tight rocks and reservoir pay rocks. No rock is discarded and the total hydrocarbon column reaches its maximum.
When the PHIE_cutoff is increased slightly, we start to reject very tight rocks that don't bear much oil and the total hydrocarbon column is almost the same. As PHIE_cutoff increases more, more tight rocks are rejected and the elbow point is eventually reached. This is the porosity cutoff value for which the oil succeeded to migrate and accumulate at the original reservoir conditions. -
STEP 3: Seek the elbow point for SW
Keep and freeze the VSH and PHIE elbow cutoff values picked in Steps 1 and 2. Then compute the total hydrocarbon column while scanning water saturation cutoffs from right to left (100%, 95%, 90%, ..., 0%), accepting only those rocks for which (VSH < VSH_cutoff), (PHIE > PHIE_cutoff), and (SW < SW_cutoff). A plot of pairs {SW_cutoff, HCOL)} would show the elbow point to pick a SW cutoff value.
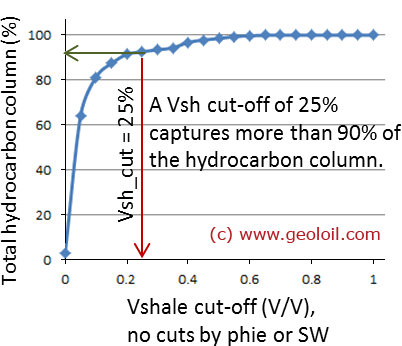
Step 1: This real plot shows a typical curve behaviour to
pick the elbow point for a VSH cutoff. Not in all cases the elbow
point shows clearly like in this example. Usual values of VSH cutoffs
for clastic oil reservoirs range from 20% to 35%. In those cases
where the VSH cutoff was computed as high as 40% or more, odds
are that the VSH model was too pessimist, perhaps when a linear
Index of Gamma Ray VSH was used.
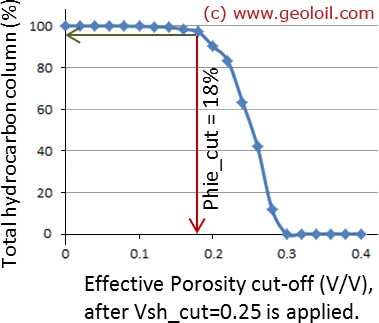
Step 2: This real plot shows a typical curve behaviour to
pick the elbow point for a PHIE cutoff. Not in all cases the elbow
point shows clearly like in this example. Usual values of PHIE cutoffs
for clastic and carbonates oil reservoirs range from 10% to 25%.
Some natural gas and CO2 reservoirs could go as low as 5% or less.
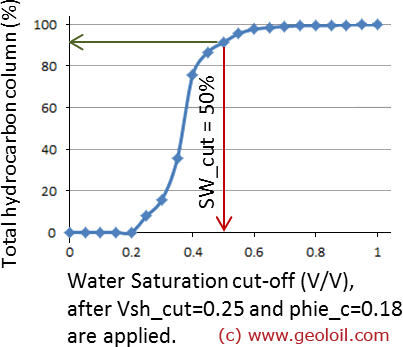
Step 3: This real plot shows a typical curve behaviour to
pick the elbow point for a SW cutoff. Not in all cases the elbow
point shows clearly like in this example. Usual values of SW cutoffs
for clastic and carbonates oil reservoirs are around 50%.
From a fluid geo-dynamics point of view, the computed cutoffs find what where the threshold values of Shale Volume, Porosity, and Water Saturation for which the hydrocarbon succeeded to migrate at the original reservoir conditions of pressure and temperature. That is, the hydrocarbon had mobility to displace the water through non sealing rocks at its geological time. Hence, it should be exploitable by conventional recovery processes, thus the name "pay" is used. This cutoffs determination algorithm works as a reasonable method to differentiate seals against pay rocks with movable hydrocarbons.
REMARKS:
-
Cutoffs for gas reservoirs will be completely different
The computed cutoffs depend on rock-fluid interactions (and even pressure and temperatures). While a (VSH > 35%) and a (PHIE < 10%) could be a barrier for medium and heavy oils, gas might flow easily under those conditions due to its lower viscosity and wettability behaviour.
-
Do not apply or use a SW cutoff into a reservoir simulation grid model
You must declare to the simulator all the existing fluids, even those zones bearing 100% of water, like aquifers. Use the full ternary VSH, PHIE and SW cutoffs only for mapping, economic screening, and volumetric purposes. For numerical reservoir simulation, use only VSH_cutoff and PHIE_cutoff to compute the Net-To-Gross ratio NTG include files. However, if you are lucky enough and have access to several relative permeability curves, you could arrange several sets for different combinations of VSH and PHIE intervals.
-
Different wells, even in the same formation's member could show different cutoffs
Since rock properties and reservoir conditions vary for different locations, the petrophysical cutoffs could be easily different for several wells. If a single cutoff system is required for a reservoir, there are two approaches:
1) Take a compromised average, typical or representative cutoffs for all the wells. Do not expect to find the same elbow points or curve shapes.
2) Extend the algorithm to compute the whole 3D reservoir's Original Hydrocarbon in Place instead of the Hydrocarbon Column per well. This full volumetrics approach is the ultimate one, but requires a lot of computational effort, resources, software, and time. -
Shale Oil reservoirs have very tight cutoffs
Oil produced from shales are generated, cooked, and matured in-situ from clayey rocks kerogen. That means they usually did not need to move or migrate to reach the shales that contain them. Hence —with this hydrocarbon column technique— you may well expect that such oils are found with extreme "pseudo-cutoffs" of tight porosities like 3% and less, and VSH of 40% or more. Producibility of shale oil is normally achieved by inducing hydraulic fractures rather than the natural original rock properties.
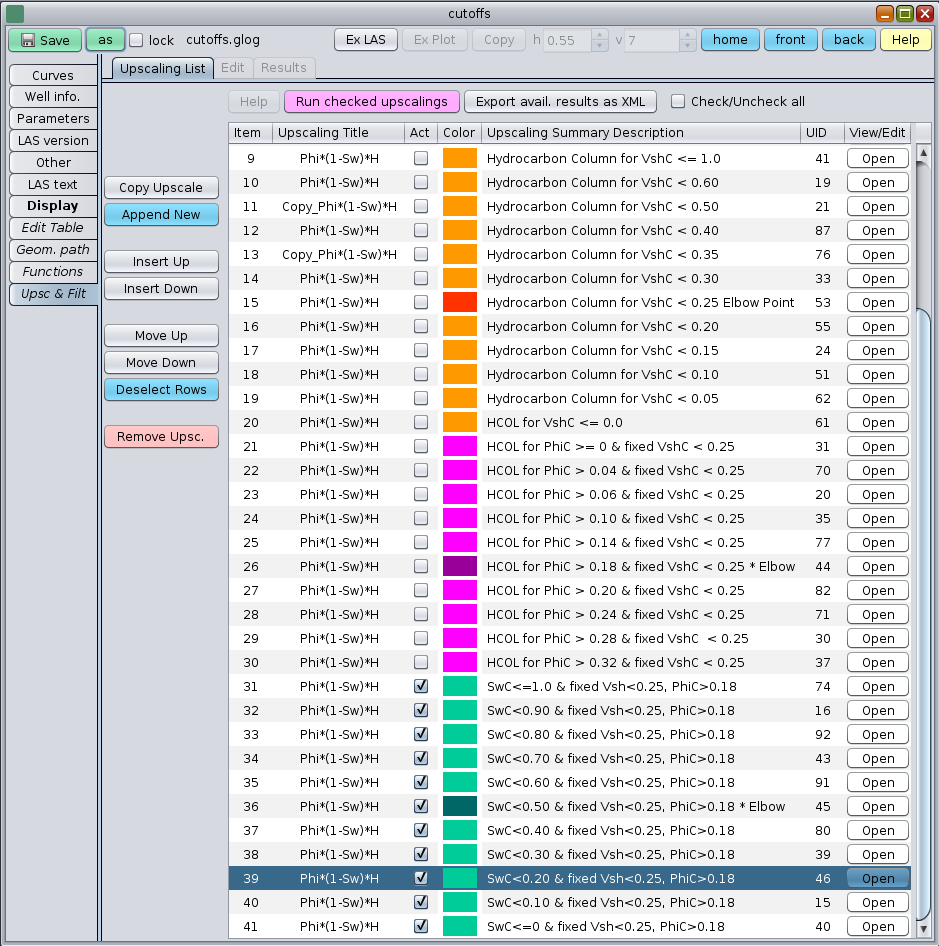
The GeolOil Upscaling listing of calculations to determine cutoffs for Vshale, Porosity, and Water Saturation
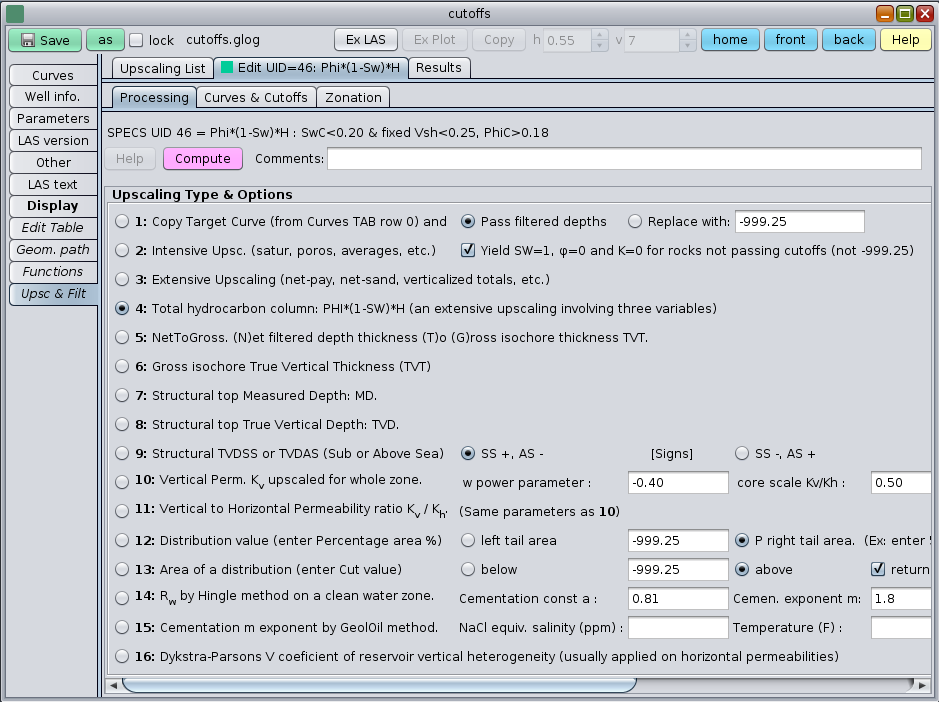
The GeolOil Upscaling Processing Tab, selected to calculate the hydrocarbon column
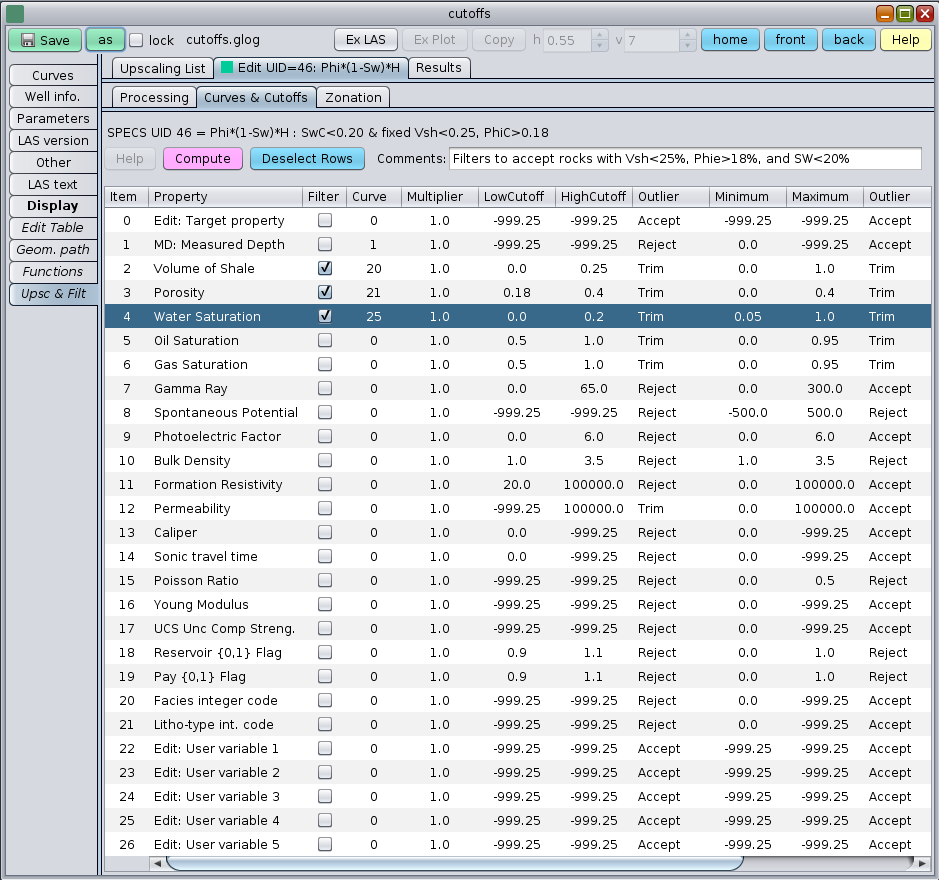
The GeolOil Upscaling Curves & Filter Tab to calculate the hydrocarbon column in a defined rock
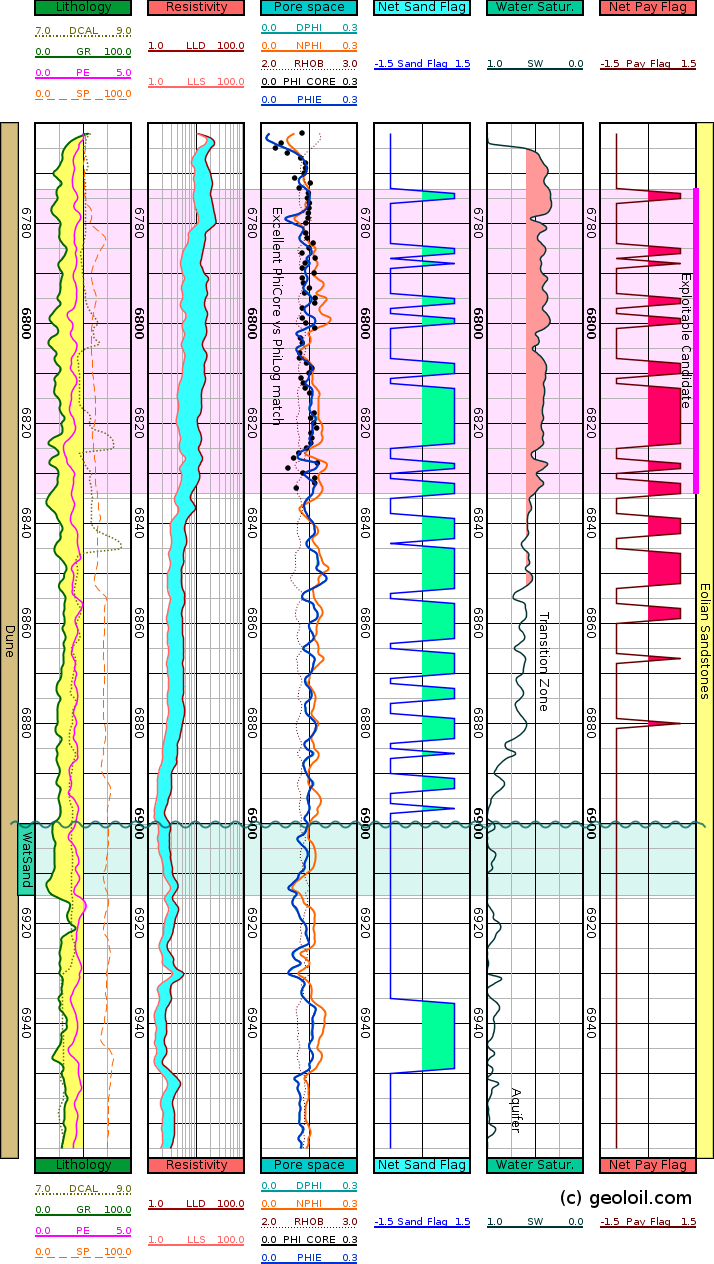
Log plot with indicator flags curves for net-sand and net-pay in an eolian reservoir

|
Related articles:
|

|
Related video:
|
|
| |


|
|
|
© 2012-2026 GeolOil LLC. Please link or refer us under Creative Commons License CC-by-ND |