Uncertainty and probability mapping is a strong point of GeolOil.
Today, computing values of P10,
P50, and P90 for a fixed
selected property, is a common feature, and GeolOil
offers computing of Pp maps, i.e.
Pp = f(x,y), a 2D map for each geological layer. This
helps to asses risks, plan exploitation strategies, as well as computing
probabilities for any outcome. Now computing pessimistic, median and
optimistic (P25, P50, P75) scenarios maps for net-pay
for instance, or any other property, is easy. This is done with our
exclusive GeolOil Script Programming Language.
The computations are based on an unique variant of beta distributions developed
by GeolOil. This
paper
now released to the public, introduces the geostatistical theory behind
the method.
|
|
|
|
|
|
|
|
|
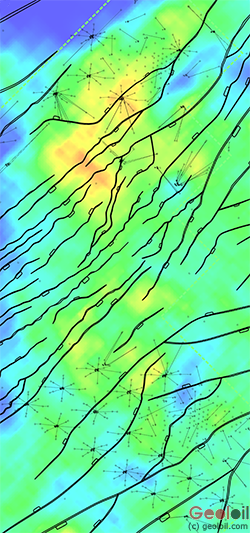
The image above shows an example of a pessimistic scenario
for the total hydrocarbon column. A set of geostatistical
realizations are performed, and then, for each (x,y) location,
the left 25% tail percentile distribution is computed, yielding a
global pessimistic scenario map, with low values
of hydrocarbon column phi*(1-SW)*h
|
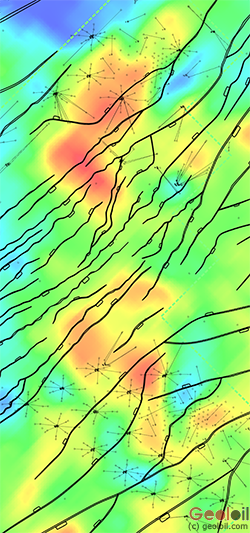
The image above shows an example of a median standard scenario
for the total hydrocarbon column. A set of geostatistical
realizations are performed, and then, for each (x,y) location,
the centered 50% median distribution is estimated, yielding a
global median scenario map, with median values
of hydrocarbon column phi*(1-SW)*h
|
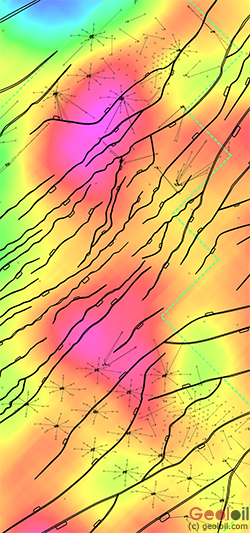
The image above shows an example of an optimistic scenario
for the total hydrocarbon column. A set of geostatistical
realizations are performed, and then, for each (x,y) location,
the left 75% tail percentile distribution is computed,
(i.e., the 25% right tail)
given a global optimistic scenario map, with high values
of hydrocarbon column phi*(1-SW)*h
|
This type of map is useful for a conservative early time
reservoir exploitation, when it is mainly into consideration
those regions more likely to hold oil accumulations, with low
level of risk.
|
This type of map is a typical standard to study present time
reservoir exploitation. It is similar to a krigged
or E type standard map.
|
This type of map is useful for exploring mature time
reservoir exploitation planning, when it is mainly into consideration
the findings of new oil accumulations regions, accepting risks.
|