GeolOil brings tools to process geomechanics data. You can estimate the
stress tensor field by proper handling of solid mechanics, rock physic equations
coupled with geostatistics extended equations. Standard scalar geostatistics
and vectorial theories, no matter how sophisticated seems to be, fails completely when
applied to solve the stress tensor problems. GeolOil uses an exclusive proprietary
technology to successfully face the problem.
Also you can use our software to process standard scalar geomechanical
properties, like stiffness indicators, young modulus, and field monitoring
of geomechanic related problems, like sand rate production.
Our 3D slicer-petrophysic summaries module
allows you to either filter your log column data into a particular litho-facies
and compute properties inside that lithology, like UCS strength,
log derivate properties and correlations, or use directly lab data
without correlations to map your results.
|
|
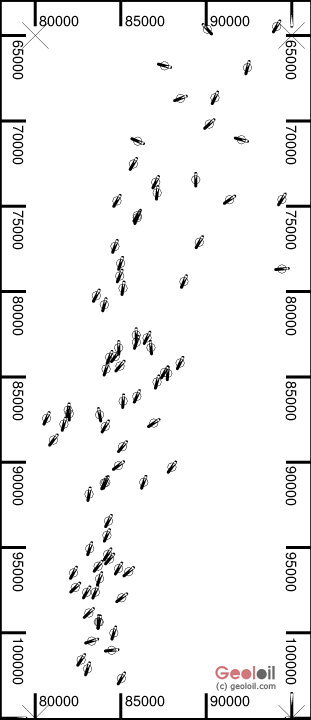
The above figures show the results of estimation of
minimum horizontal stress directions. At the upper left is mapped the set
of borehole hard, or conditional data directions of the minimum horizontal
stress stress measured, using for instance techniques like ultrasonic borehole
images (UBI), six arms caliper, etc.
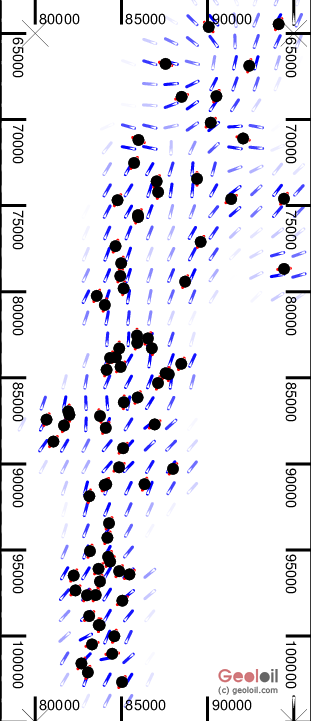
At the upper right, it is displayed the estimation of the minimum horizontal
stress directions by GeolOil. Notice how the estimation uncertainty is
also represented.
|
|
|
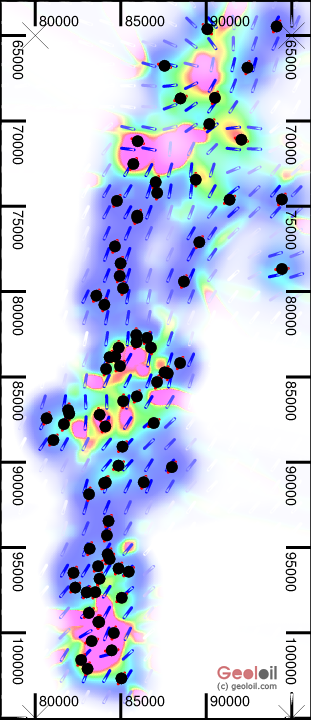
The above figures show the result of estimation of an exclusive
property defined by GeolOil as pseudo stress turbulence.
See how those areas with bigger changes in the whole stress tensor,
(either in magnitudes or directions) are represented in hot hues (red
and pink), whereas areas in relatively homogeneous stress tensor
conditions are represented in cool colors (green to blue).
The resulting map is quite interesting, representing in the same
display simultaneously three properties: The directions of minimum
horizontal stress, the stress tensor heterogeneity turbulence, and its uncertainty.
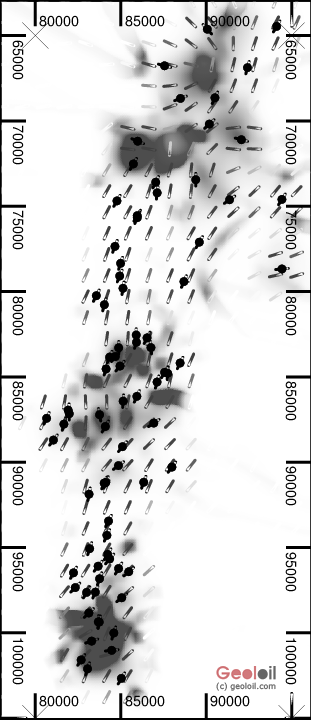
The map to the right is similar, but representing high stress
turbulence areas in a grey scale, ideal for photocopying, and
b&w journal paper publishing.
If your company needs to address horizontal or deviating drilling
and borehole stability studies, GeolOil brings to you a valuable tool.
|
|
|
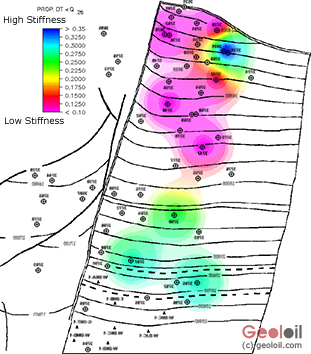
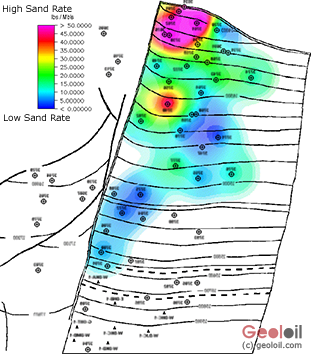
The above figures illustrate the use of GeolOil to monitor the
geomechanical behaviour of a field. At the left is displayed
an index of well log derived rock stiffness filtered for sandstone reservoir rocks.
At the right, the sand rate production is mapped. This may help
to study risky production zones.
|